Docs and this page
Docs / LIVE
LIVE guide
Read the SPX dealer book on one chart, have its levels watched for you, ask about them in plain words, and take them into your own tools.
LIVE: today's session every second, alerts, ASK, the levels API and the platform integrations, and 5 LAB credits a month. Every finished session is free in REPLAY. The LIVE product page · Markdown copy
Why it matters
Dealers hedge the options they hold, and that hedging concentrates on a few strikes. LIVE measures where it concentrates, rebuilt from every options print each second, and draws it where price can meet it.
It answers one question: where does the dealer book stand right now, and how much weight sits on each level? It does not answer which way price goes. That was tested three independent ways on this data: momentum on negative gamma does not replicate over 2022 to 2026, the sign of net gamma carries nothing across horizons, and a random entry time beats a gamma-threshold crossing.
What holds up is size. Read the levels and the expected move for position size, stop width and whether the day's geometry suits your own model, never for direction.
Around the chart, LIVE carries what makes the book usable during a session: alerts on a price or a level that moves, delivered to Telegram, your phone or your server; ASK, which answers about the minute on screen from these same numbers; the OPTIONS tester, which puts a structure against the book; and the levels API and platform integrations, which put the flip and the walls on the chart you already trade from.
Where to find it
LIVE is the terminal at firmtape.com, mode LIVE at the top left while the market trades. Every layer and control works the same on a finished session in REPLAY, free. Alerts, ASK and OPTIONS are buttons on the terminal's toolbar; the alert destinations and the integration tokens are under Account.
| You want | Go to |
|---|---|
| Today's walls and levels on the chart | Chart bar, WALLS and LEVELS |
| Gamma on every strike | The ladder columns at the right of the chart; LADDER on the chart bar |
| Another book | A column's head card: VOL, OI or MEAS |
| The day's numbers | READOUTS tab at the chart's left edge, or the header chip |
| The whole session's book as a heatmap | LAYERS > HEATMAP |
| Another symbol, ES or NQ | The symbol chip, or just start typing a ticker |
| An alert on a price or a level | Right-click the chart (hold it on a phone), Alert at ... or Alert when price reaches ... |
| Alerts in Telegram, on your phone or on your server | Account, Level alerts, WHERE ALERTS GO |
| Plain-word answers about the screen | ASK on the toolbar, or Cmd+\ |
| A structure read against the book | OPTIONS on the toolbar, then click strikes |
| The levels on your platform's chart | Integrations, then Account, Integrations |
Read it in 30 seconds
- Find the flip (amber) and price's side of it: the header chip's REG says POS, NEG, SPLIT or AT FLIP across the books.
- Find the nearest call wall (green) and put wall (red), and read their width: a fat line is a heavy wall.
- Read EM in the header chip: the share of the opening expected move already used. Past 100% the tape tends to keep moving and go less far.
- Look at the ladder: are the bars stacked near price or spread out? A few heavy strikes near price is a concentrated book.
- The bell plates on the price scale are your alert lines: a dashed line is a fixed price, a named line follows its level.
How to use it
Read the book
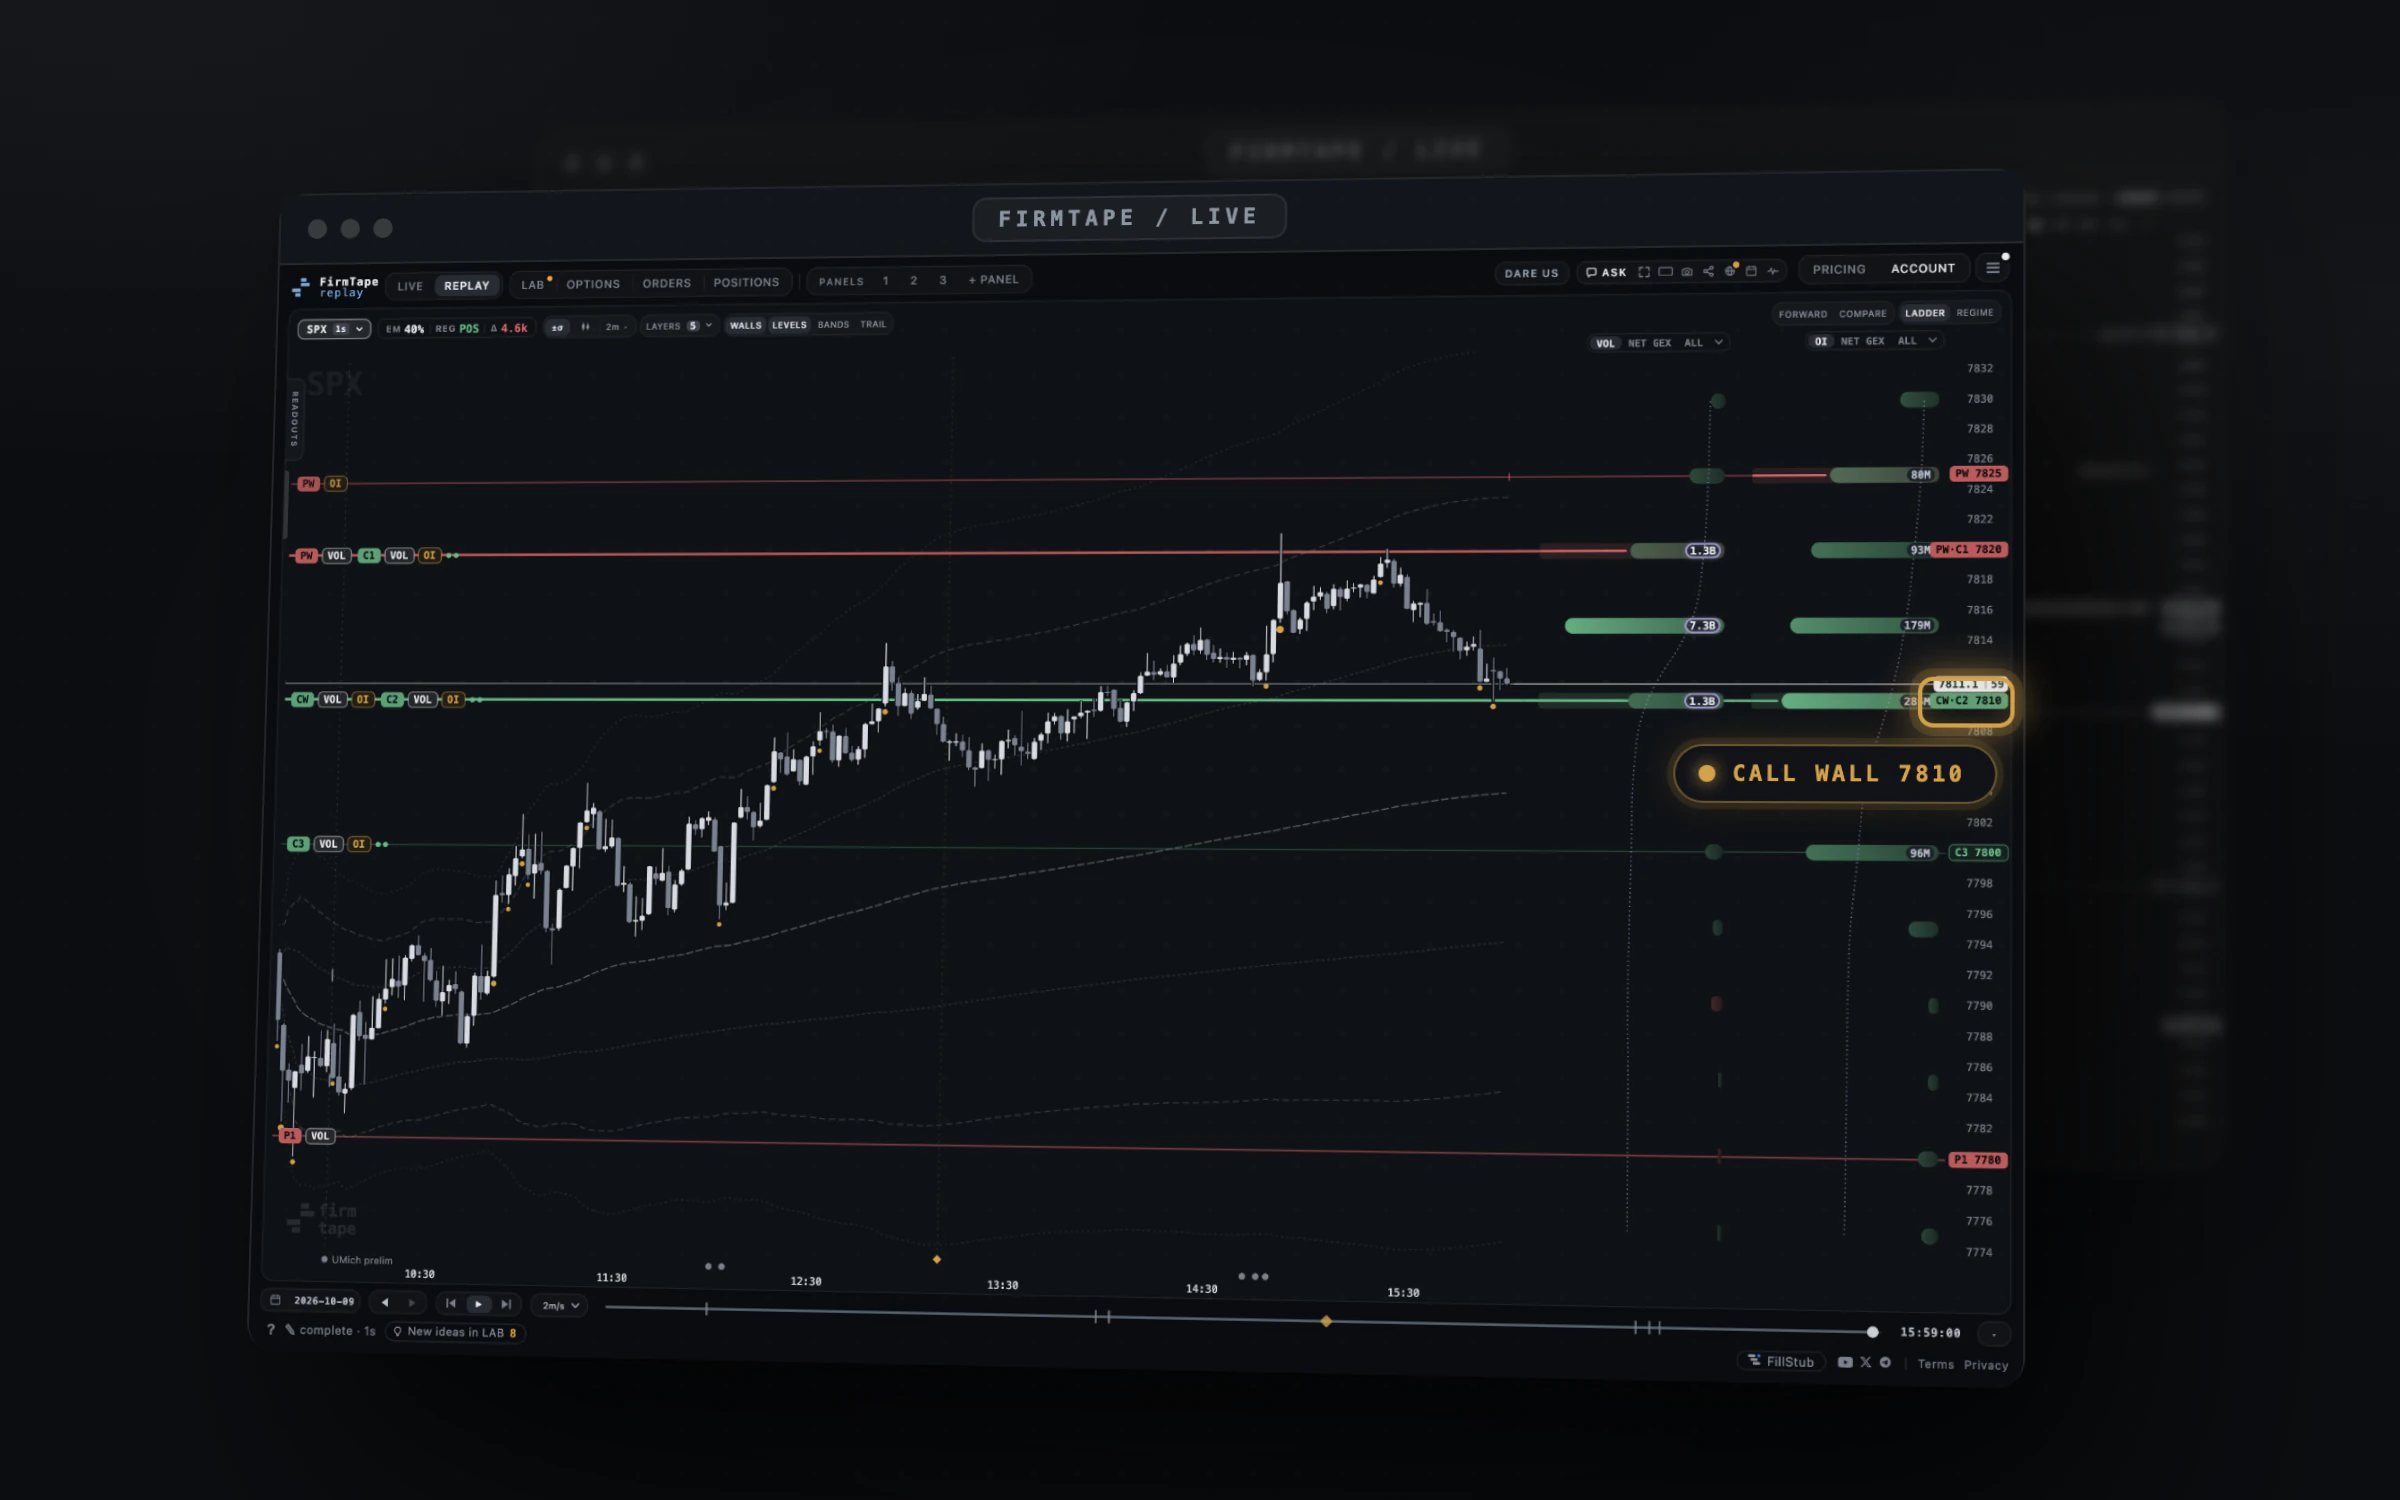
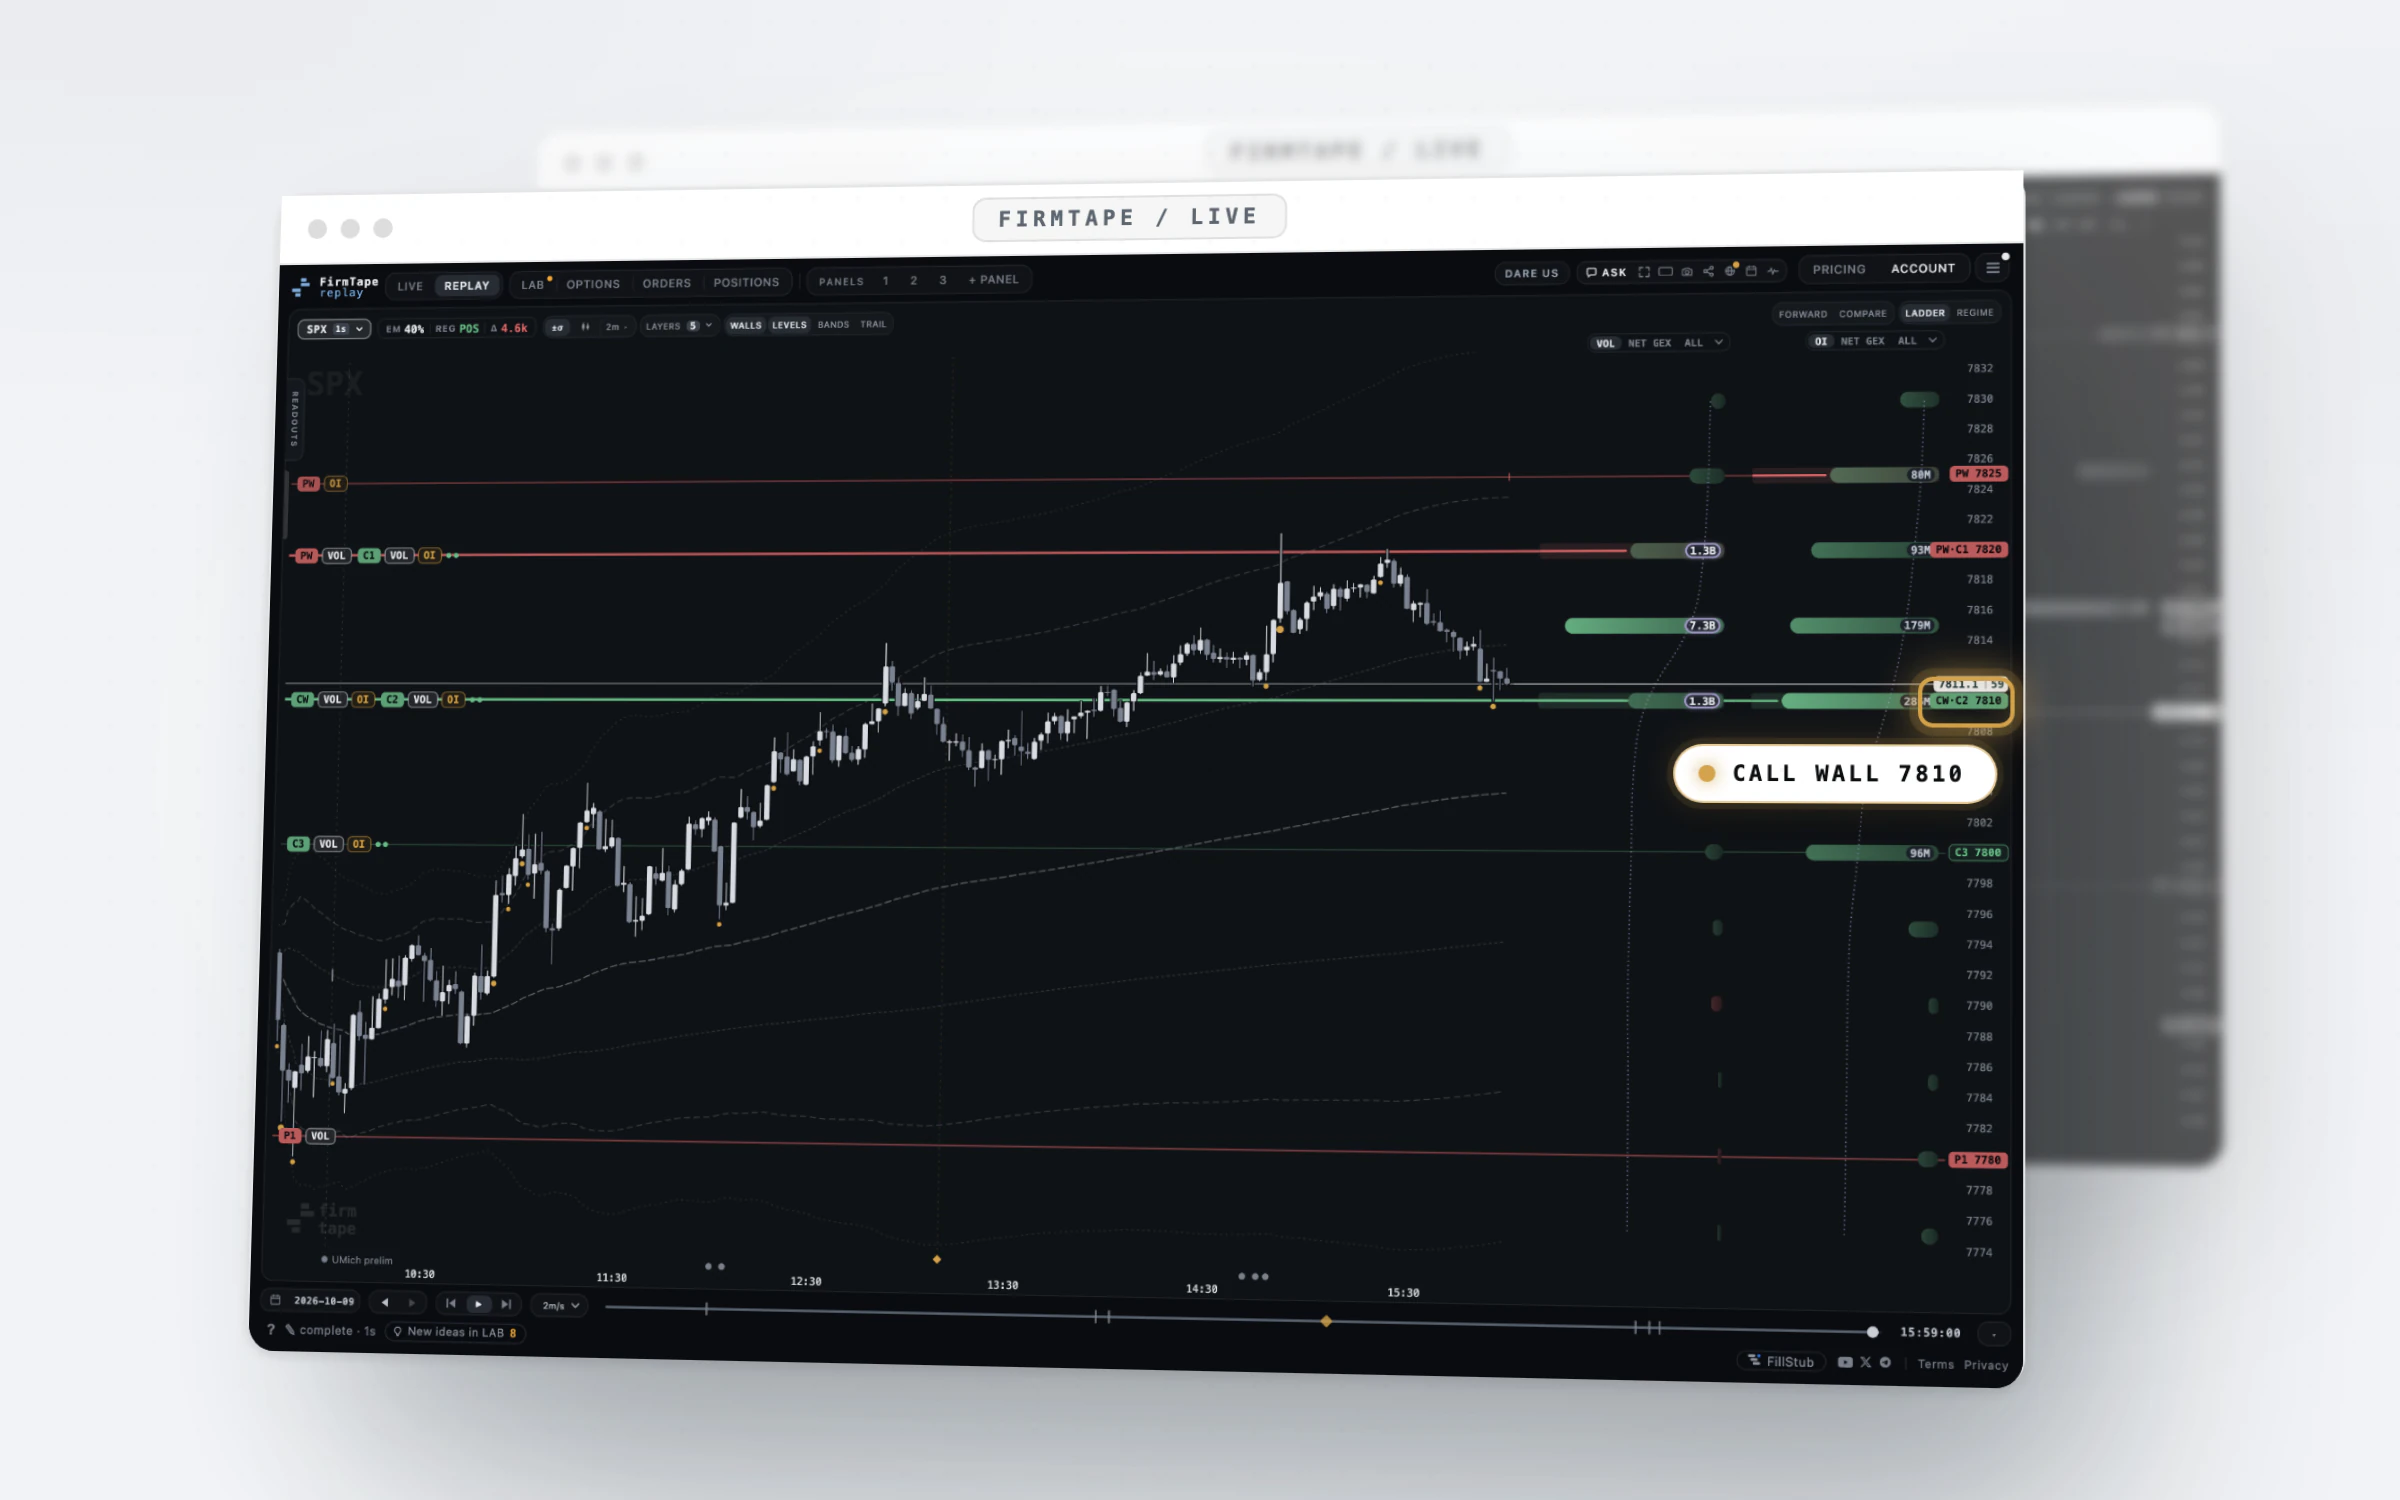
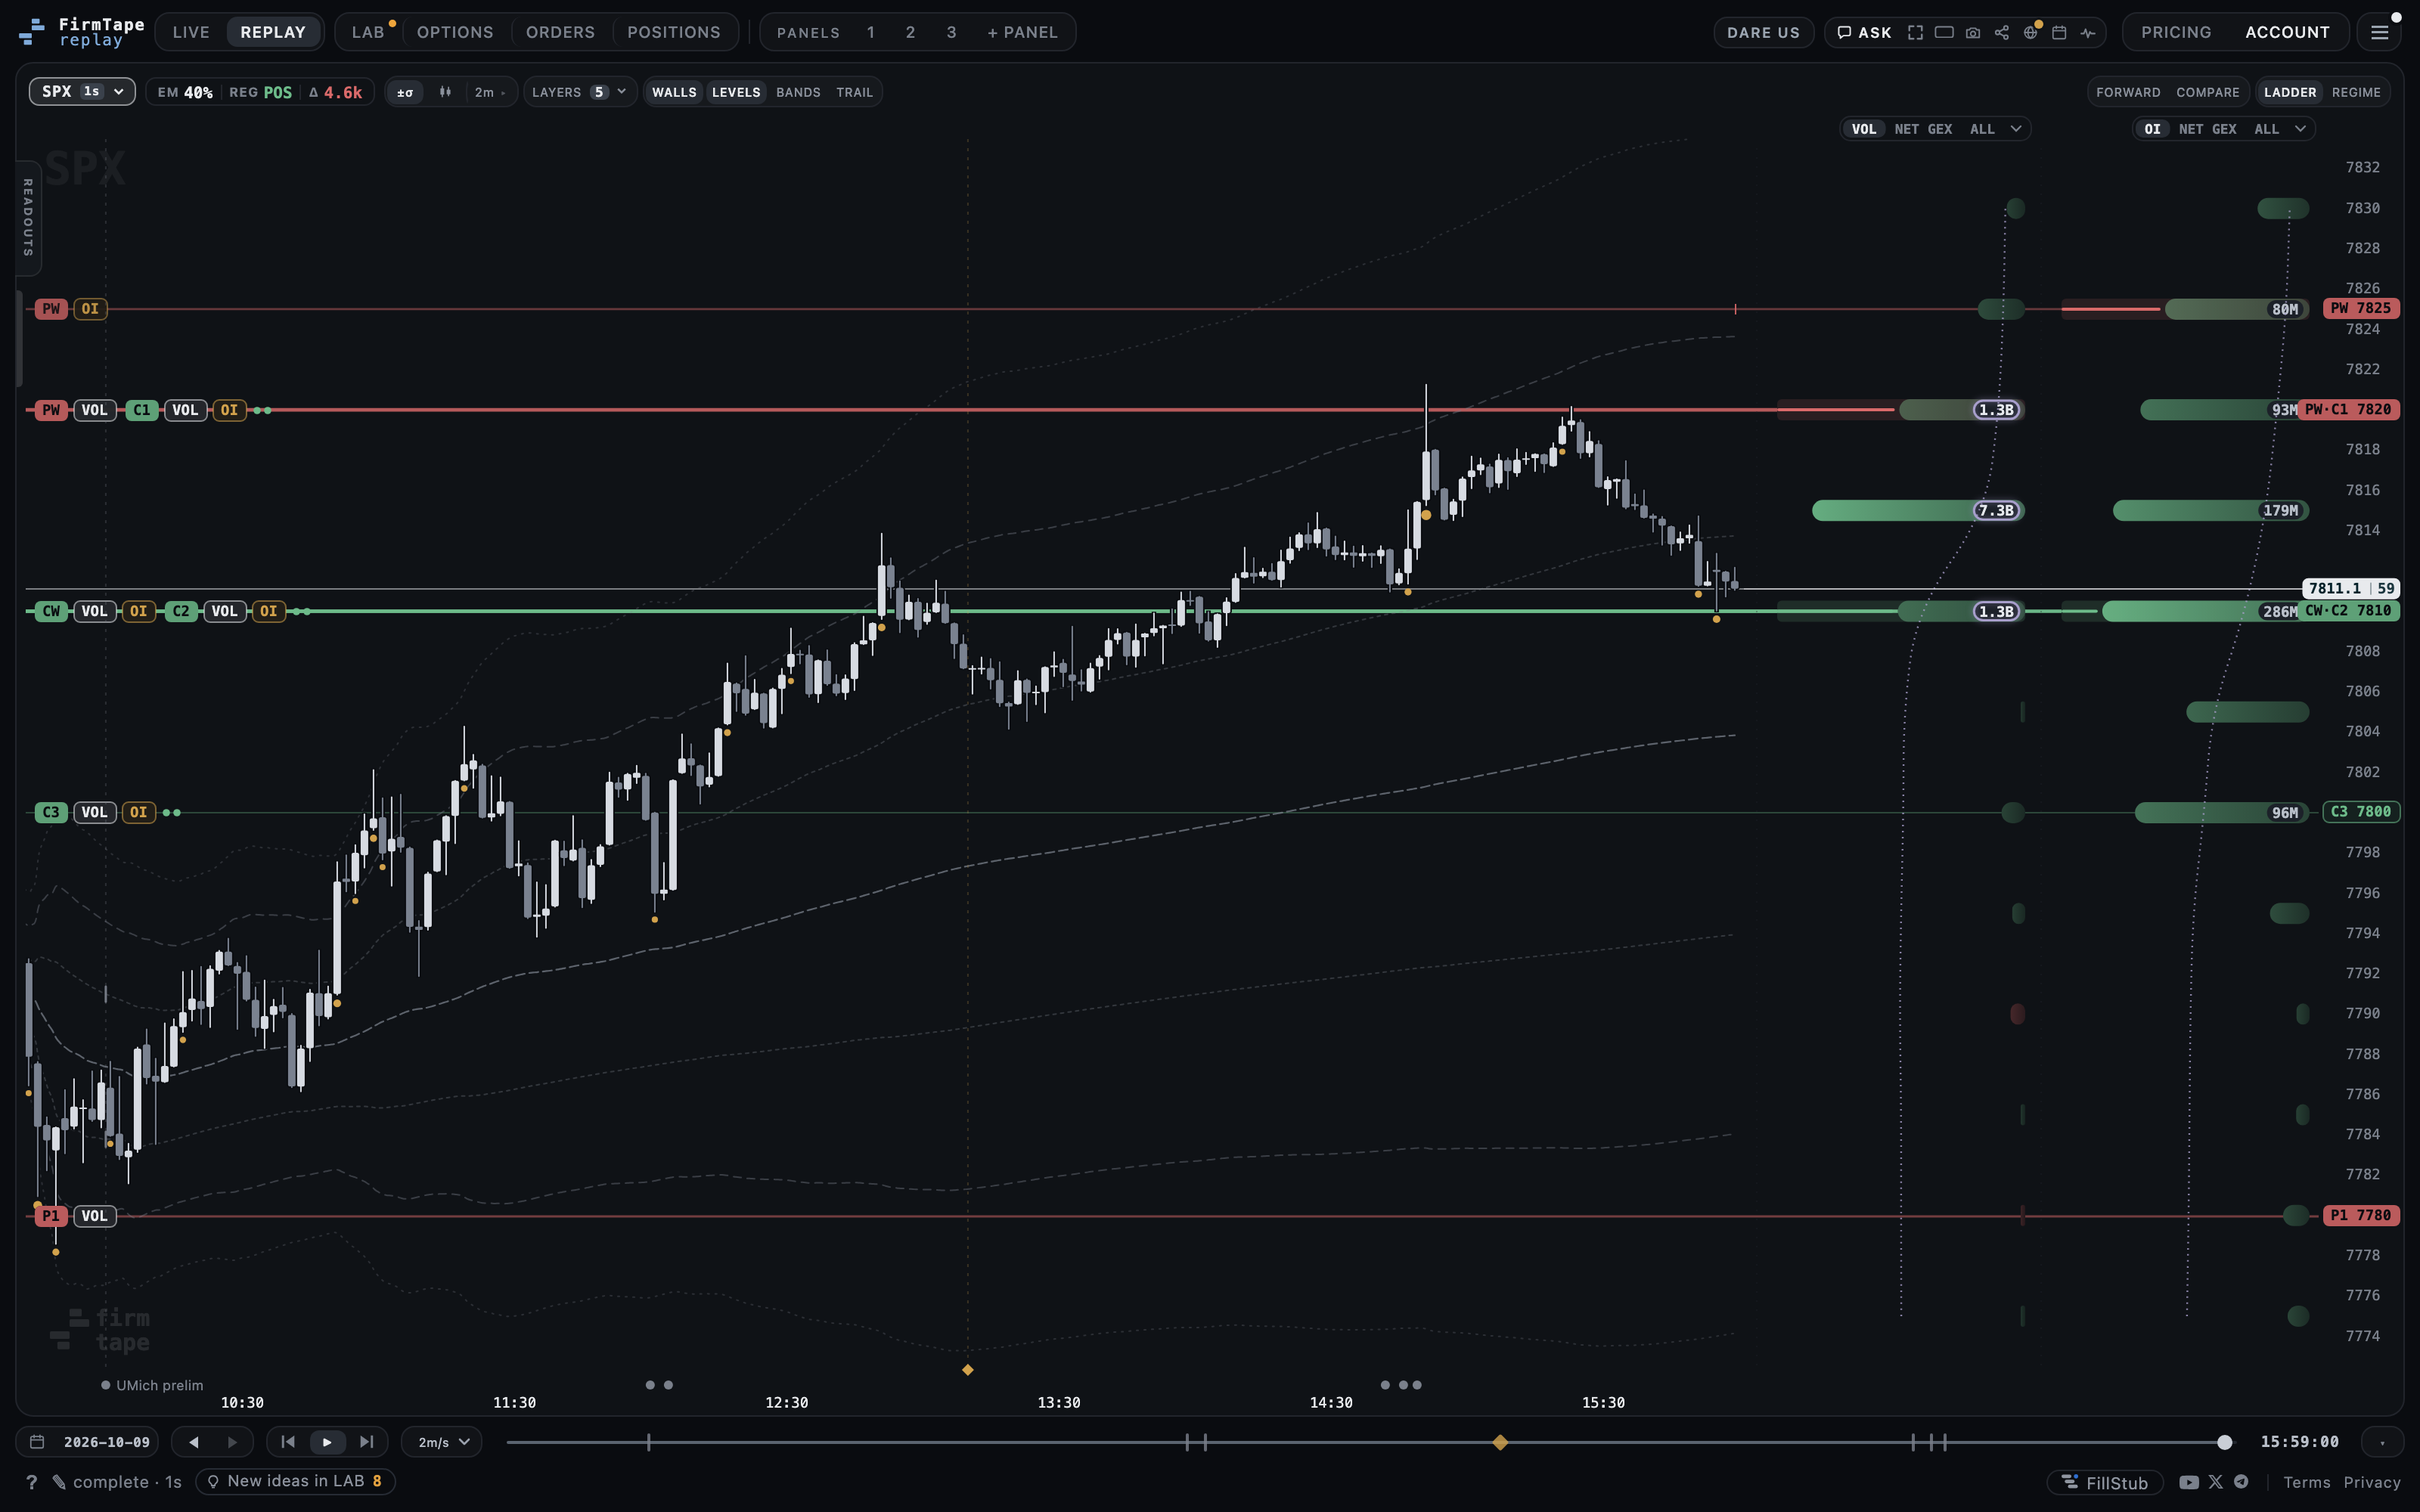
The chart at a glance#
Why: one screen where price and the dealer book share a scale, so every level sits where price can meet it. Where: firmtape.com, the terminal itself. Plan: LIVE for today; free on every finished session.
- Open firmtape.com: a finished session opens in REPLAY; press LIVE while the market trades.
- Read the top bar for modes and tools, the chart bar under it for the symbol, the header chip and the switches.
- Read each line by its name at the left end and its plate on the price scale.
How to read it:
- Green lines are positive-gamma strikes, red negative, amber the flip; the chips name the book.
- The playback bar sits at the bottom on every session.
Related: LIVE: Walls and levels · LIVE: Ladder columns · REPLAY: The playback bar
LIVE and REPLAY#
Why: one chart for both: today as it trades, and any finished day to study. Where: LIVE and REPLAY at the top left; the wordmark under the logo says which one you are in. Plan: LIVE needs the LIVE plan; REPLAY is free for every finished session.
- Press LIVE to follow today's session, once a second.
- Press REPLAY to open a finished day; the date on the playback bar opens any other.

How to read it:
- Outside market hours LIVE shows waiting for the session on the status line with the clock in New York time.
Related: REPLAY: The playback bar · REPLAY: The session calendar
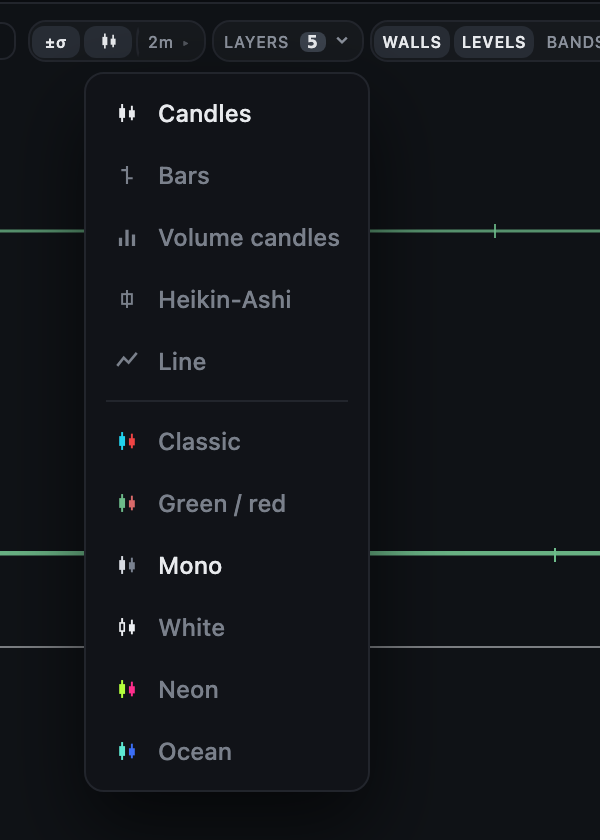
Candles, period and candle type#
Why: the price in the form you read best, on a period that suits the zoom. Where: the candle button and the period chip on the chart bar. Plan: LIVE for today; free on every finished session.
- Click the candle button for the type: Candles, Bars, Volume candles, Heikin-Ashi or Line, and a colour scheme.
- Click the period chip to step through 5s, 15s, 1m, 2m, 5m and 15m; AUTO lets the zoom choose.
- Read the 1s chip beside the symbol: on a per-second day price moves every second.
Related: LIVE: Chart navigation
Chart navigation#
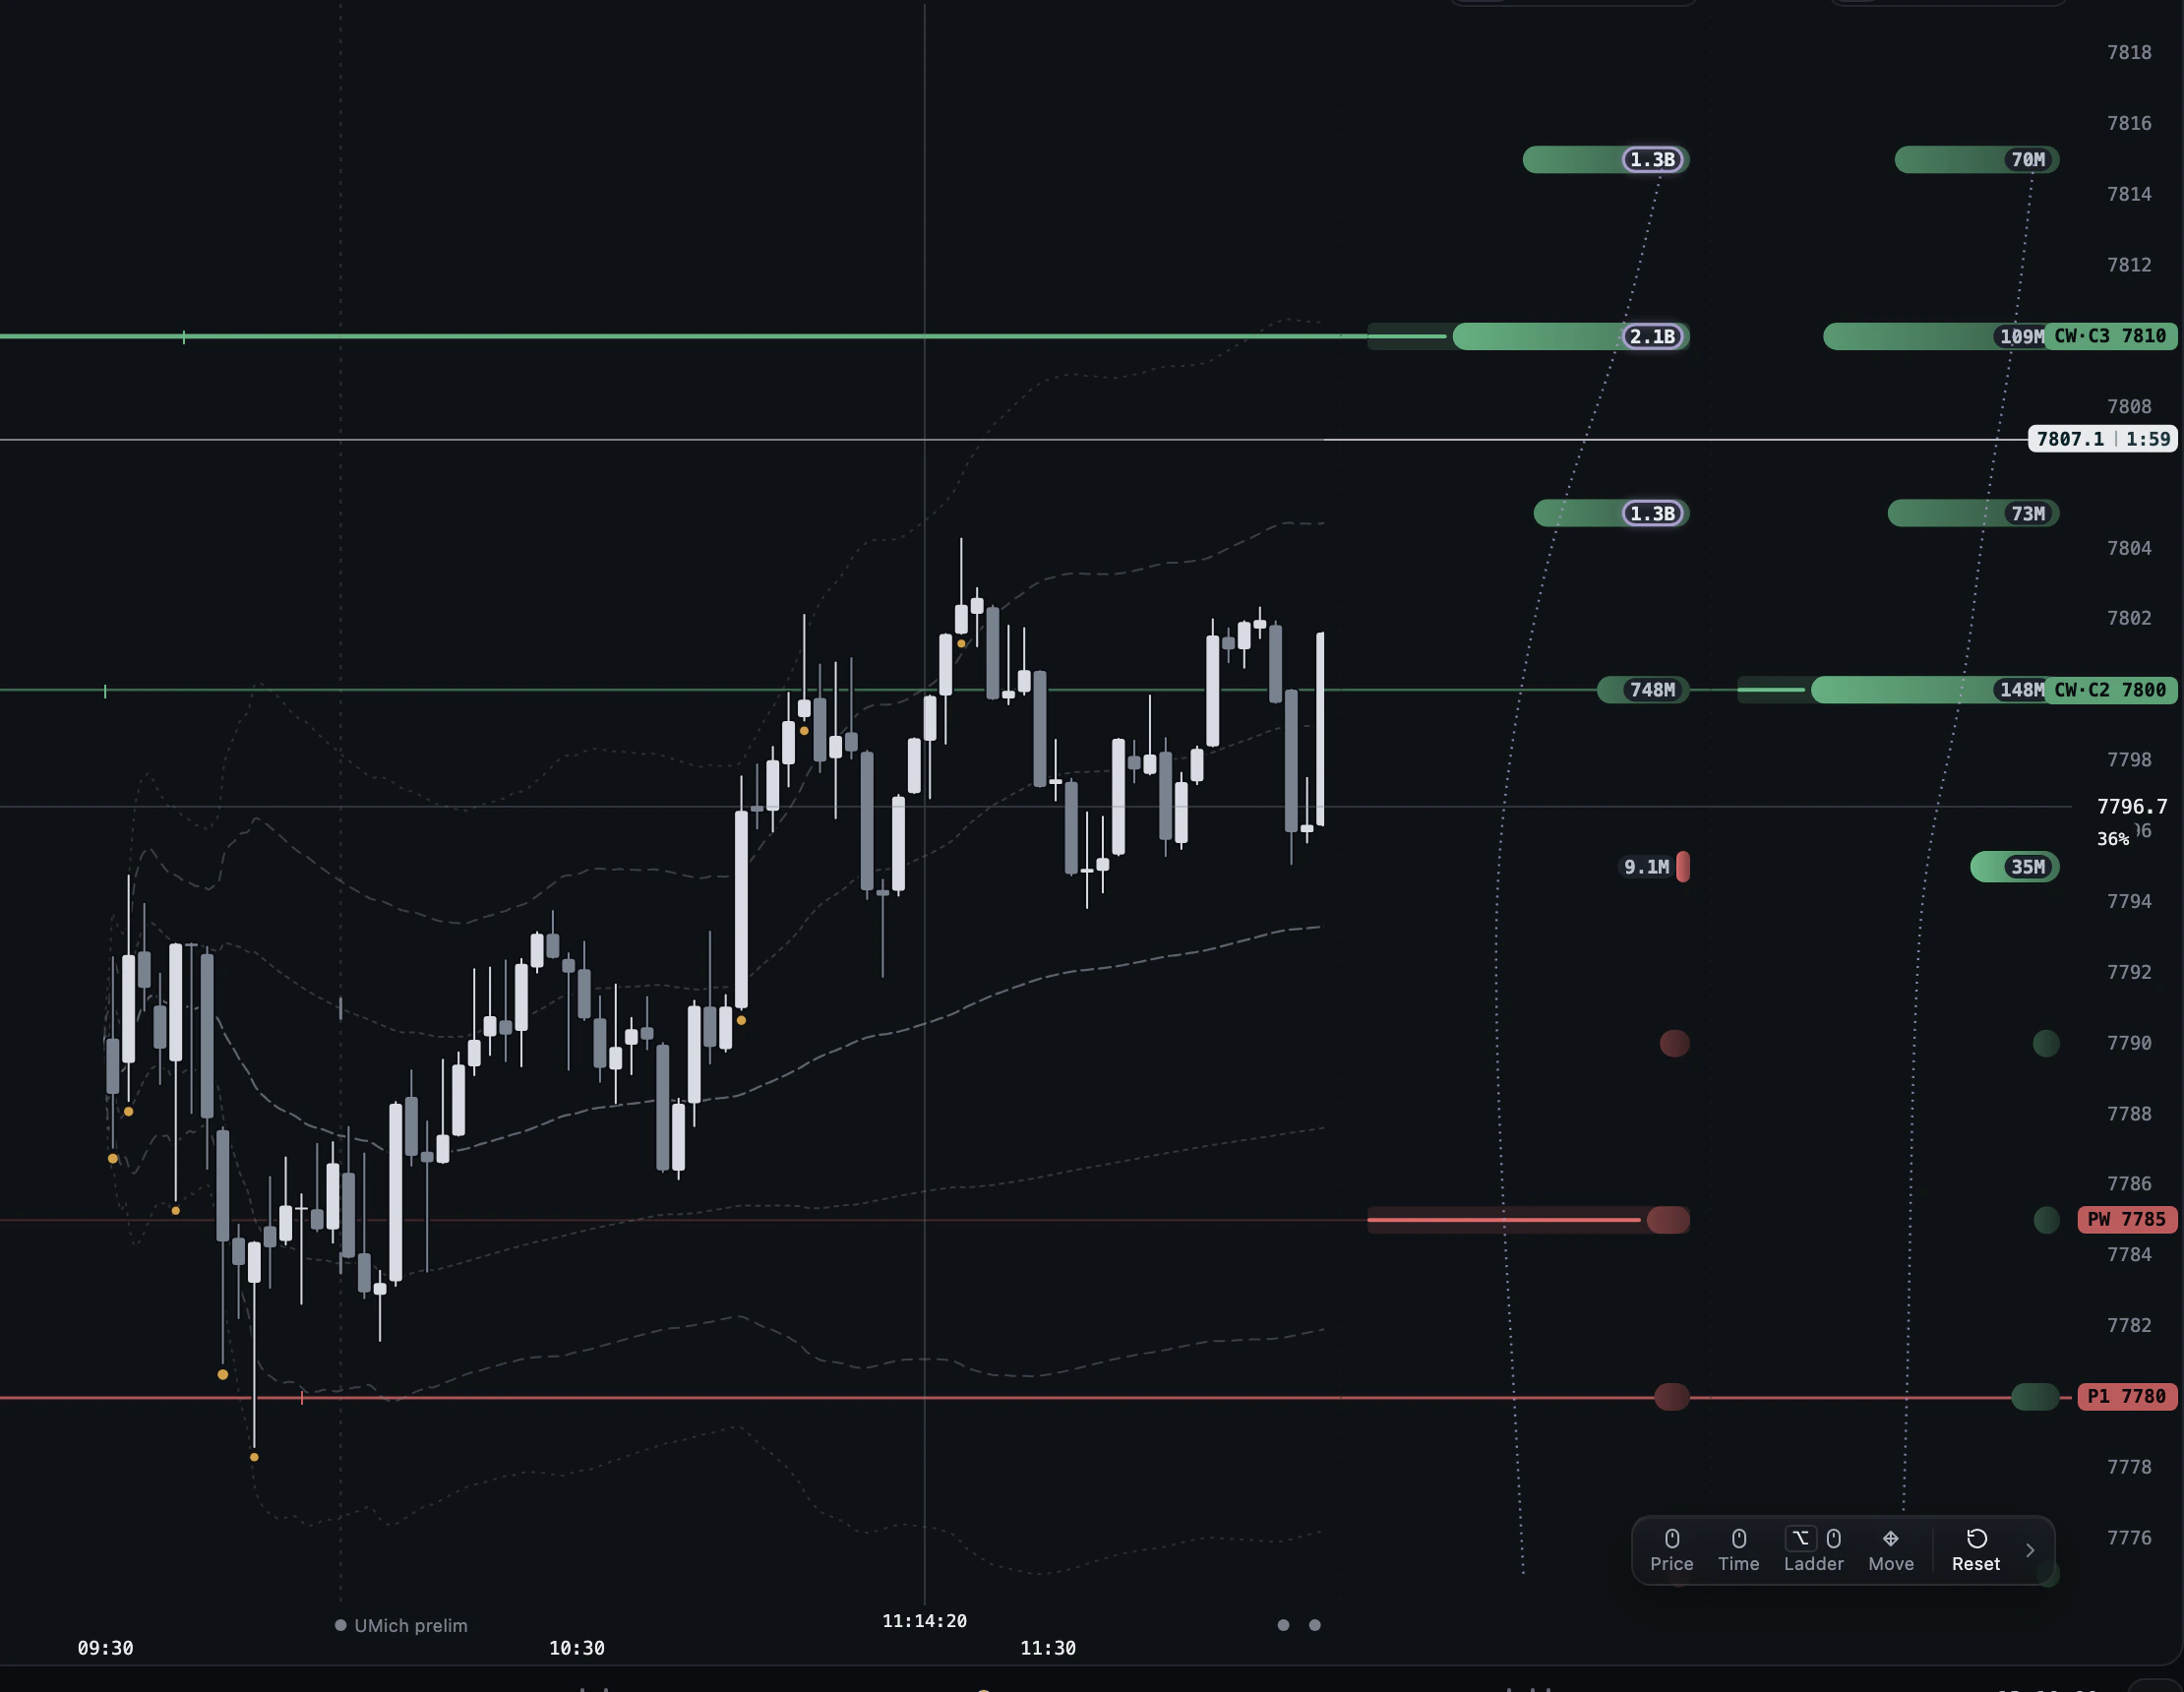
Why: look closer at one stretch of the day without losing your way back. Where: the chart itself; the small panel at the bottom right while the view is set by hand. Plan: LIVE for today; free on every finished session.
- Scroll to zoom in time, drag to pan.
- Drag the price scale to stretch prices.
- Use the small panel (Price, Time, Ladder, Move, Reset) that appears while the view is set by hand.
- Double-click the chart, or press Reset, to go back to auto. Dragged handles such as the ladder width stay.
Related: LIVE: Candles, period and candle type · LIVE: Ladder columns
Ladder columns#
Why: the whole shape of the book, strike by strike, level with the price it belongs to. Where: the columns between the plot and the price scale; LADDER on the chart bar turns them on, dims or hides them. Plan: LIVE for today; free on every finished session.
- Click a column's head (for example VOL NET GEX ALL) to open its card.
- Pick the book: VOL, OI or MEAS; the expiry: ALL, 0DTE or NEXT.
- Pick the metric: NET GEX, DEX, VEX, ABS GEX, or the contract counts NET OI, TOTAL OI, NET VOL, TOTAL VOL.
- Pick the flow window (NOW, 5m, 15m, 30m, OPEN), the look (BARS or HEAT) and whether its walls draw as LINES and BANDS.
- Add a column with + on a head, remove one with x; drag a column's left edge to widen or narrow its bars.
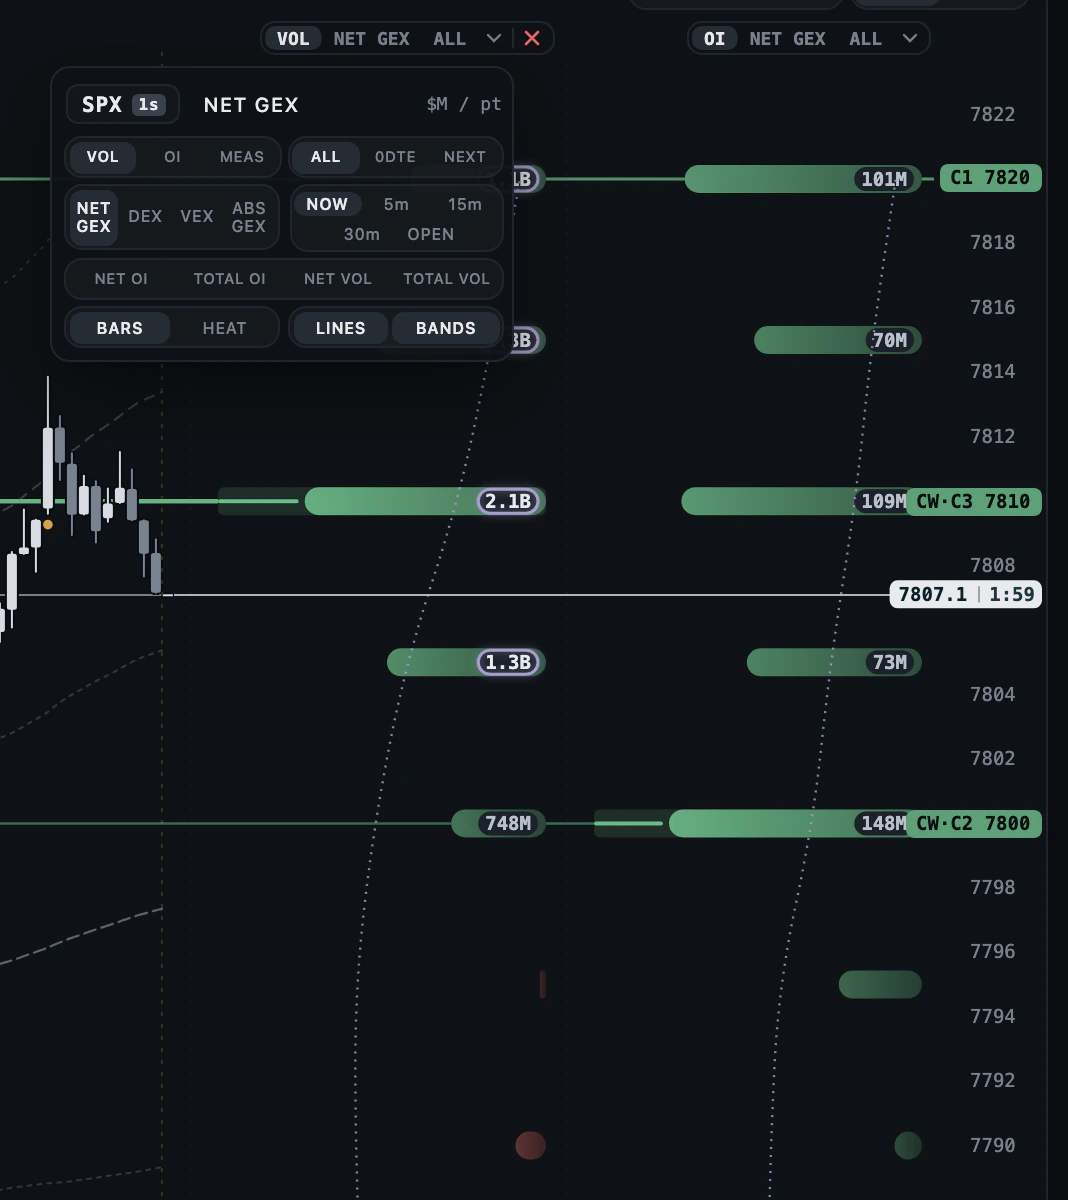
What it measures: Each row is one strike, level with its price. The figure on a row is the gamma on that strike in dollars per point; the bar's length is its size against the column's largest.
| Control | What it does |
|---|---|
| VOL, OI, MEAS | The book the column reads |
| ALL, 0DTE, NEXT | Every expiry, today's, or the next one |
| NET GEX, DEX, VEX, ABS GEX | Net gamma, delta, vanna, or gross gamma |
| NET OI, TOTAL OI, NET VOL, TOTAL VOL | Contract counts instead of a greek |
| NOW, 5m, 15m, 30m, OPEN | The window the flow is summed over |
| BARS, HEAT | A bar per strike, or a shaded cell per strike |
| LINES, BANDS | Whether this column's walls draw on the chart |
| left edge | Drag to widen or narrow the bars; remembered for the next visit |
How to read it:
- Green bars are positive gamma, red negative.
- HEAT shows where the book clusters at a glance; BARS is better for comparing two strikes.
- A heavy bar near price is concentration, not a direction.
Limits: Tickers have the VOL and OI books only, and no DEX or VEX: those need a signed position.
Related: LIVE: The three books · LIVE: Walls and levels · LIVE: PANELS
The three books#
Why: the same session read three ways, and where they disagree is information. Where: a ladder column's head card, and LAYERS > LEVELS OF for the lines. Plan: LIVE for today; free on every finished session.
| Book | What it is |
|---|---|
| volume | The call-put signed volume book at 0DTE: the conventional public gamma object, built here independently from the tape. In LAB: net_gamma_vol. |
| open interest | The same construction on open interest, summed over four expiries, so its net is not comparable with the 0DTE books. In LAB: net_gamma_oi. |
| measured | Signed from the actual trade tape with the prevailing quote. It disagrees with the convention book about the regime in 43.0% of all minutes over 1,086 archived sessions. In LAB: net_gamma_meas. |
The per-book readouts (flip, walls, net gamma, distance to the flip), the regime, the gamma percentile and the flow of gamma are in READOUTS and are LAB columns too, each named for its book: flip_vol_dist, call_wall_vol_dist, gamma_pctl_vol and their _meas and _oi twins.
How to read it:
- An unqualified level means the volume book.
- Two books on one line agree on that price; a level in one book only is that book's view.
Related: LIVE: Ladder columns · LIVE: READOUTS drawer · LAB: The LAB vocabulary
Header chip and REGIME#
Why: the three numbers that frame the minute, without opening anything. Where: the chip beside the symbol on the chart bar; REGIME on the right of the chart bar. Plan: LIVE for today; free on every finished session.
- Read EM: the share of the opening expected move already used.
- Read REG: POS, NEG, SPLIT or AT FLIP, price against each book's flip.
- Read Δ: the largest 30-minute change in the book.
- Click the chip to open READOUTS; press REGIME for a thin strip at the plot's right edge, green above the chart book's flip and red below.

How to read it:
- SPLIT means the books disagree about the regime.
- A regime is a position, not a forecast.
Related: LIVE: READOUTS drawer · LIVE: The expected move
The expected move#
Why: the one reading on this screen that has held up: the market's own price for the session's move. Where: the EM chip beside the ticker and section 01 of READOUTS. Plan: LIVE for today; free on every finished session.
- Read used so far: how much of the move priced at the open the day has already travelled, in either direction.
- Read left to close: the expected move from here to the close, off the current straddle.
- Read the close bands: where the close lands on most days, from the straddle.
What it measures: The ATM 0DTE straddle, doubled to a range. Over 1,088 sessions it is calibrated: the close lands inside one expected move 72.4% of the time, and as a variance forecast it is unbiased (E[z²] 1.03). In LAB: em_used.
| Control | What it does |
|---|---|
| used so far | Share of the opening move travelled, anchored at the opening print |
| CHOP | Past 100%: after the opening move is spent, realised vol over the next 30 minutes is no lower, but the net distance travelled is 17 to 27% smaller |
| left to close | The expected move from here to the close |
| after 15:55 | Left to close greys out: implied vol is read from a vanishing time to expiry |
How to read it:
- Take the expected move as the day's span and size against it: twice as wide as usual means half the position for the same risk, or a stop twice as far.
- Past 100%, expect the tape to keep moving and go less far: smaller targets rather than a chase.
- Every number is about magnitude, never about which way.
Limits: SPX only: the other tickers have no straddle here. It follows the cursor, the day and the symbol, not the book switches: the straddle is the market's price, not one of our books. Our own gamma-based forecast of the move added nothing to the straddle (t +0.03 against +3.54).
Developer reference: /docs/developers/live/expected-move
Related: LIVE: READOUTS drawer · LIVE: Header chip and REGIME · Expected move calibration
READOUTS drawer#
Why: the expected move, flow by strike, the regime in three books and the vol, read at the cursor. Where: the READOUTS tab on the chart's left edge, or a click on the header chip. Plan: LIVE for today; free on every finished session.
- Open READOUTS and pick the book at the top: VOL, OI or MEAS.
- 01 Expected move: the share used, the move left to close, the close ranges and the median close.
- 02 Flow by strike: the strikes where gamma was added or shed over 5, 15 or 30 minutes.
- 03 Regime: spot against each book's flip, and the distance to the flip through the day.
- Further sections: reach (touch and close odds for the call wall, flip and put wall), the book's largest change, ATM IV and skew, and how much of the book expires today.
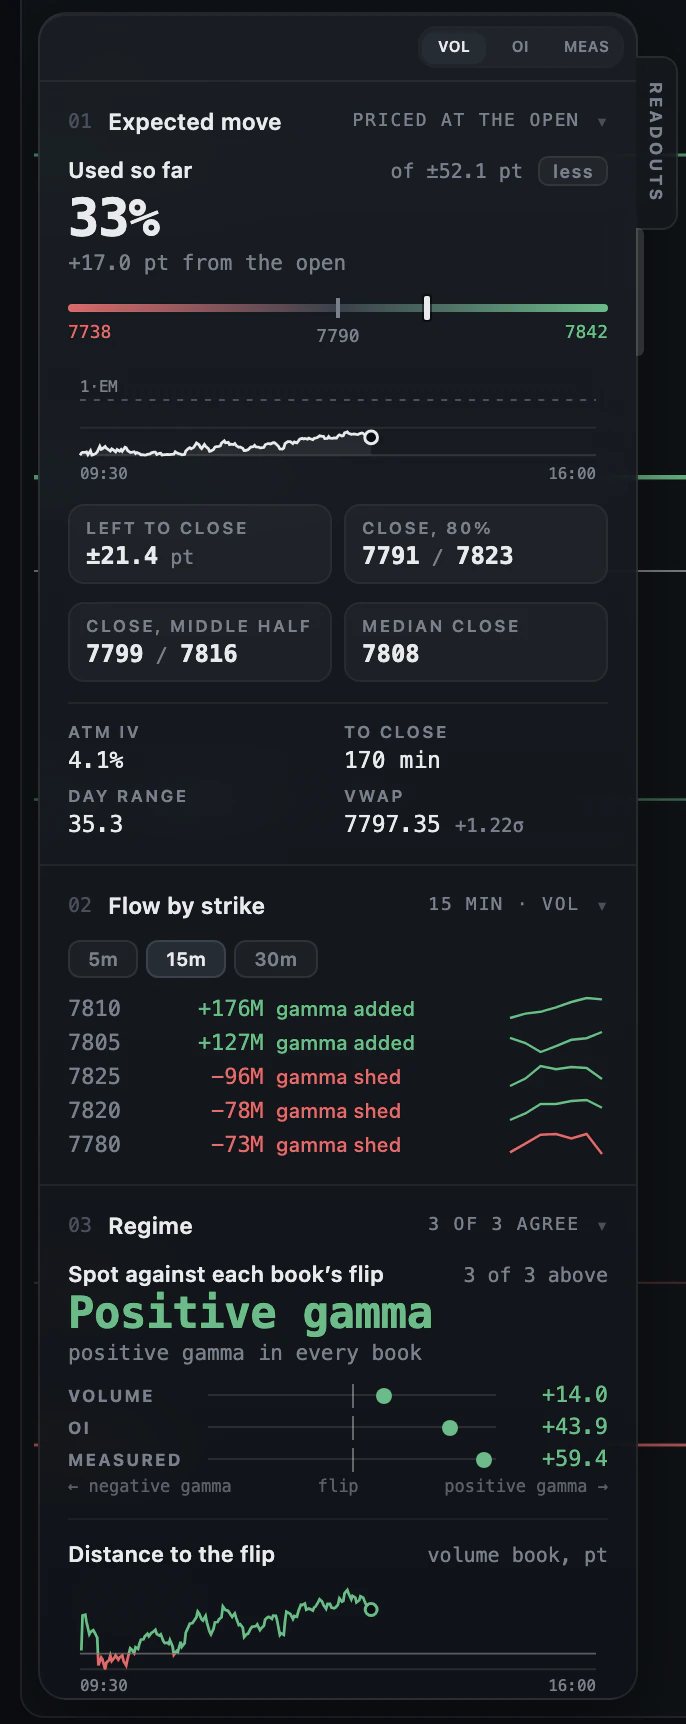
What it measures: ATM IV at the foot of the expected move is the vol the market is charging. It climbs about threefold from the open to the close on a 0DTE, so its 30-minute change mostly reads the clock and is no longer shown. In LAB:atm_iv,atm_iv_chg30.
How to read it:
- "Gamma added" and "gamma shed" describe the book, not anyone's trade.
- Touch odds are frequencies from the archive at the same distance, not a forecast for today.
Limits: Each section reads the minute under the cursor. A ticker shows the sections its five-minute book can fill.
Related: LIVE: The expected move · LIVE: The three books · LIVE: Header chip and REGIME
See the walls
Walls and levels#
Why: the strikes the book leans on, drawn where price can meet them, each with its weight. Where: the chart bar switches WALLS, LEVELS and BANDS; which books draw is LAYERS > LEVELS OF. Plan: LIVE for today's session; free on every finished session.
- Turn on WALLS to draw each book's call wall and put wall with its chip and price tag (CW 7810).
- Turn on LEVELS to add the levels of interest: strikes that keep standing out in the VOL and OI books, ranked C1, C2, P1, P2.
- In LAYERS > LEVELS OF, pick one, two or three books. Where two books agree on a price, their chips sit side by side on one line.
- Turn on BANDS to paint each wall over the strike interval it owns.
- Set the levels filter to hide levels holding less than a share of the strongest; 8 to 20% is the useful range, 0 shows everything.
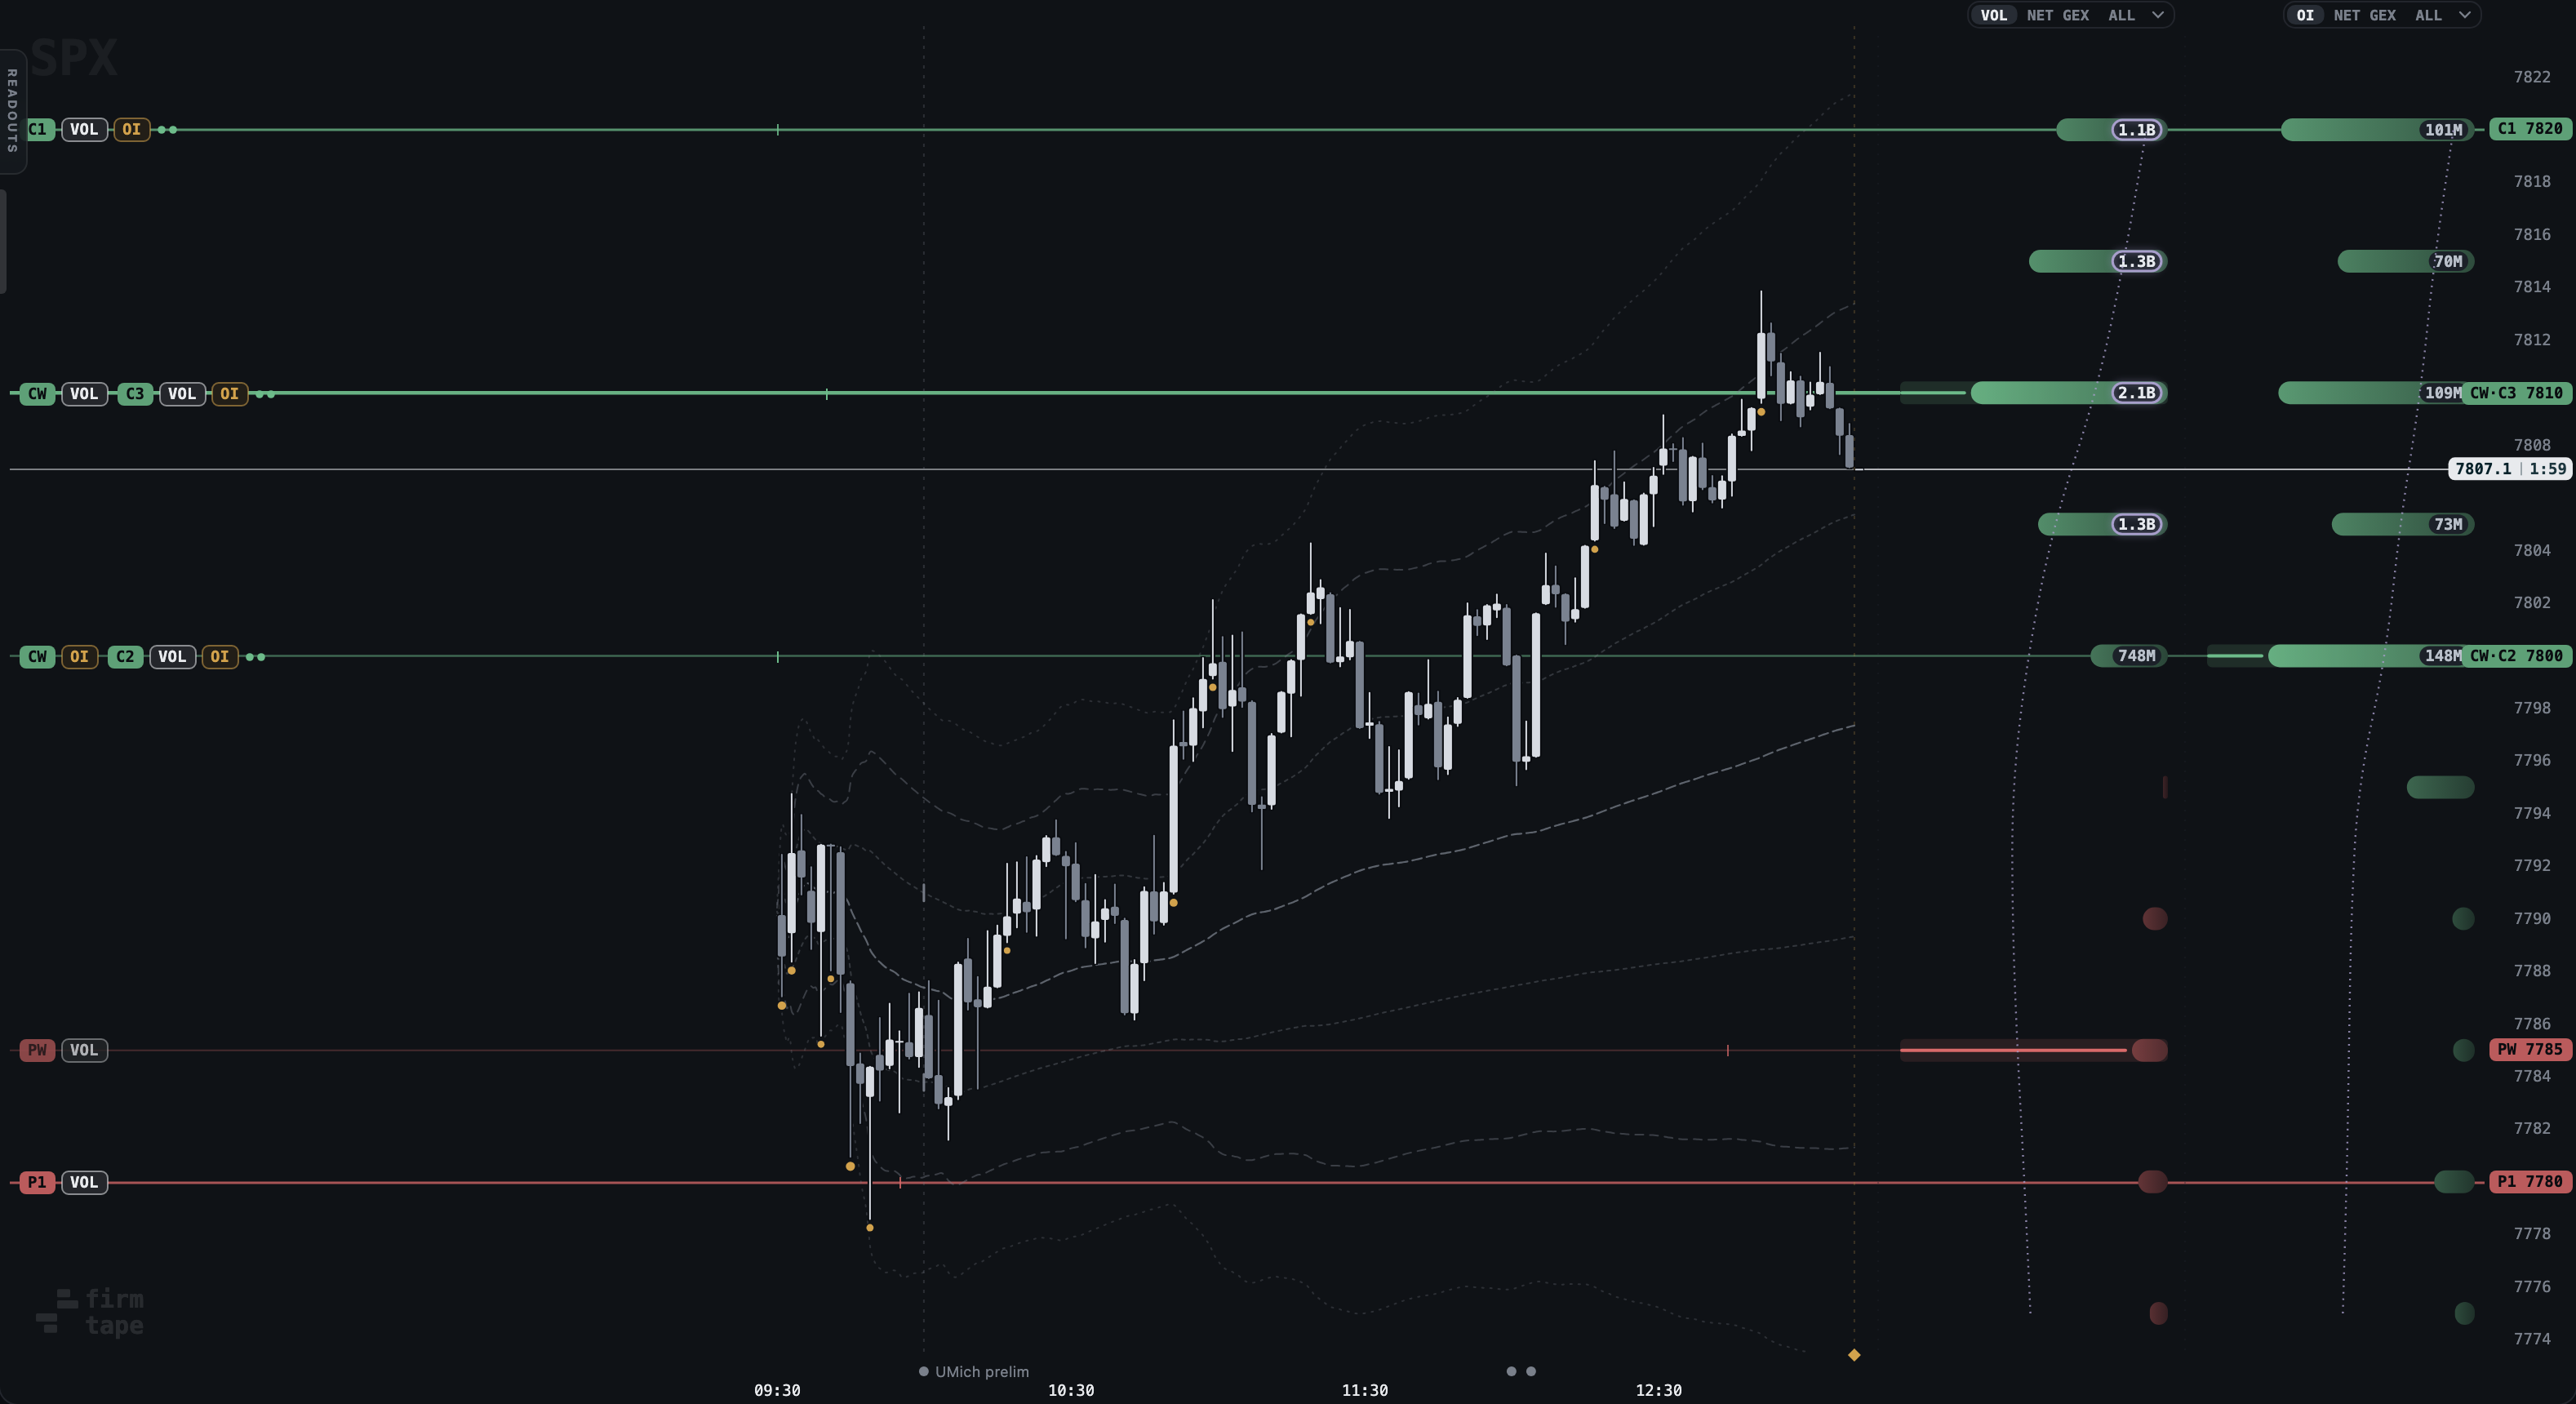
What it measures: A wall is the major positive or negative gamma strike of a book; width is that strike's share of the near-money gamma in the window. A level of interest is a strike that has stood out for a while and stays for the day once it has held.
| Control | What it does |
|---|---|
| WALLS | Call wall and put wall of each selected book, with chips and price tags |
| LEVELS | Levels of interest from the VOL and OI books |
| BANDS | Half a strike step either side of each wall, opacity by share; never on the flip |
| LEVELS OF | Which books draw their levels (one to three) |
| levels filter | Minimum share of the strongest drawn level; a line below says how many were hidden |
How to read it:
- Colour is the kind of level, never the book: green the major positive-gamma strike, red the major negative, amber the zero-gamma flip. The book is named on the chip.
- Width is weight: a fat line is a heavy wall, a thin one a level the book barely carries.
- Fade is distance: a level about forty points away draws at roughly a quarter strength.
- OI standouts at the open (yesterday's positions) are levels from the first minute; the rest appear once their strike has held up, and a short tick marks when.
- None of it says direction. Concentrated hedging holds price on a positive-gamma strike and speeds it away from a negative one.
Limits: Whether price is drawn to strength has not been measured here; it is an open idea, not a claim. Walls, levels and session levels that meet on one price share a line and one price-scale plate (CW·C2·PDC 7620).
Related: Walls and levels, the full page · LIVE: Level card · LIVE: Session levels · LIVE: TRAIL · LIVE: Alert lines · Call wall
Level card#
Why: weigh a level before you lean on it. Where: click a level's chips at the left edge of the chart. Plan: LIVE for today; free on every finished session.
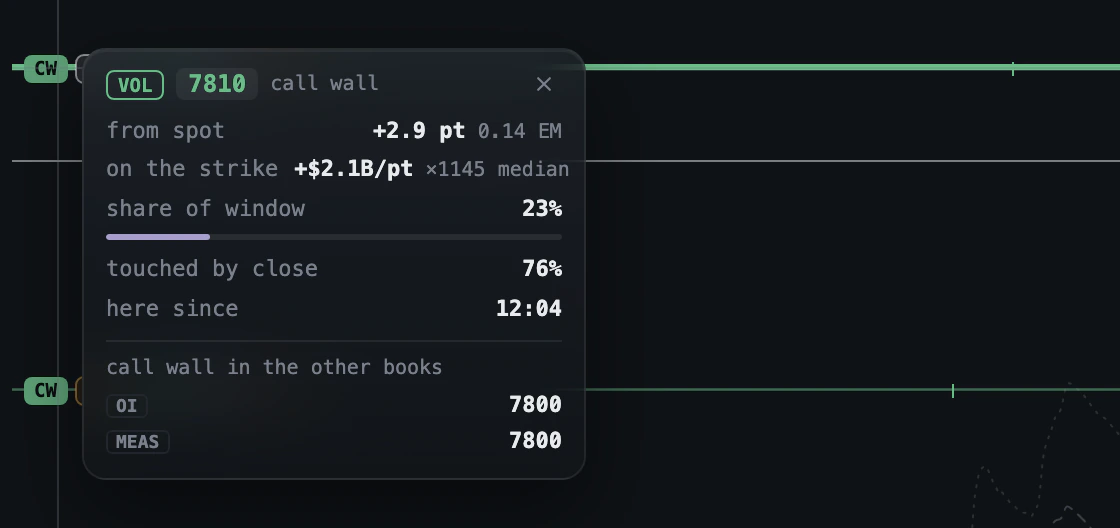
- Click the chips of a wall or level.
- Read the distance from spot in points and in expected moves.
- Read the gamma on the strike, its share of the window, how often a level at that distance is touched by the close, and since when it has stood.
- Read the same kind of level in the other two books at the foot.
How to read it:
- "Touched by close" is how often a level at that distance was reached by the close in the archive, not a forecast for this one.
Related: LIVE: Walls and levels · LIVE: The expected move
Session levels#
Why: the reference prices of the sessions around the one on screen, joined with the dealer levels where they meet. Where: LAYERS > SESSION: PD, OR, PM, ON, WEEK, MONTH. Plan: LIVE for today; free on every finished session (PM and ON in LIVE only).
- Open LAYERS in the chart's header. The SESSION row has six switches, all off until you turn them on; the chart remembers your choice.
- PD: the prior day's high, low and close (PDH, PDL, PDC).
- OR: the opening range, 09:30 to 10:00 ET (ORH, ORL), dim while it forms and final from 10:00.
- PM: the premarket high and low, 04:00 to 09:30 ET (PMH, PML), in LIVE where the premarket is on the chart.
- ON: the overnight high and low, 20:00 ET the evening before to 09:30 (ONH, ONL), the premarket included, in LIVE where the night has prints.
- WEEK: the prior calendar week's high and low (PWH, PWL); MONTH: the month's high and low to date (MTDH, MTDL).
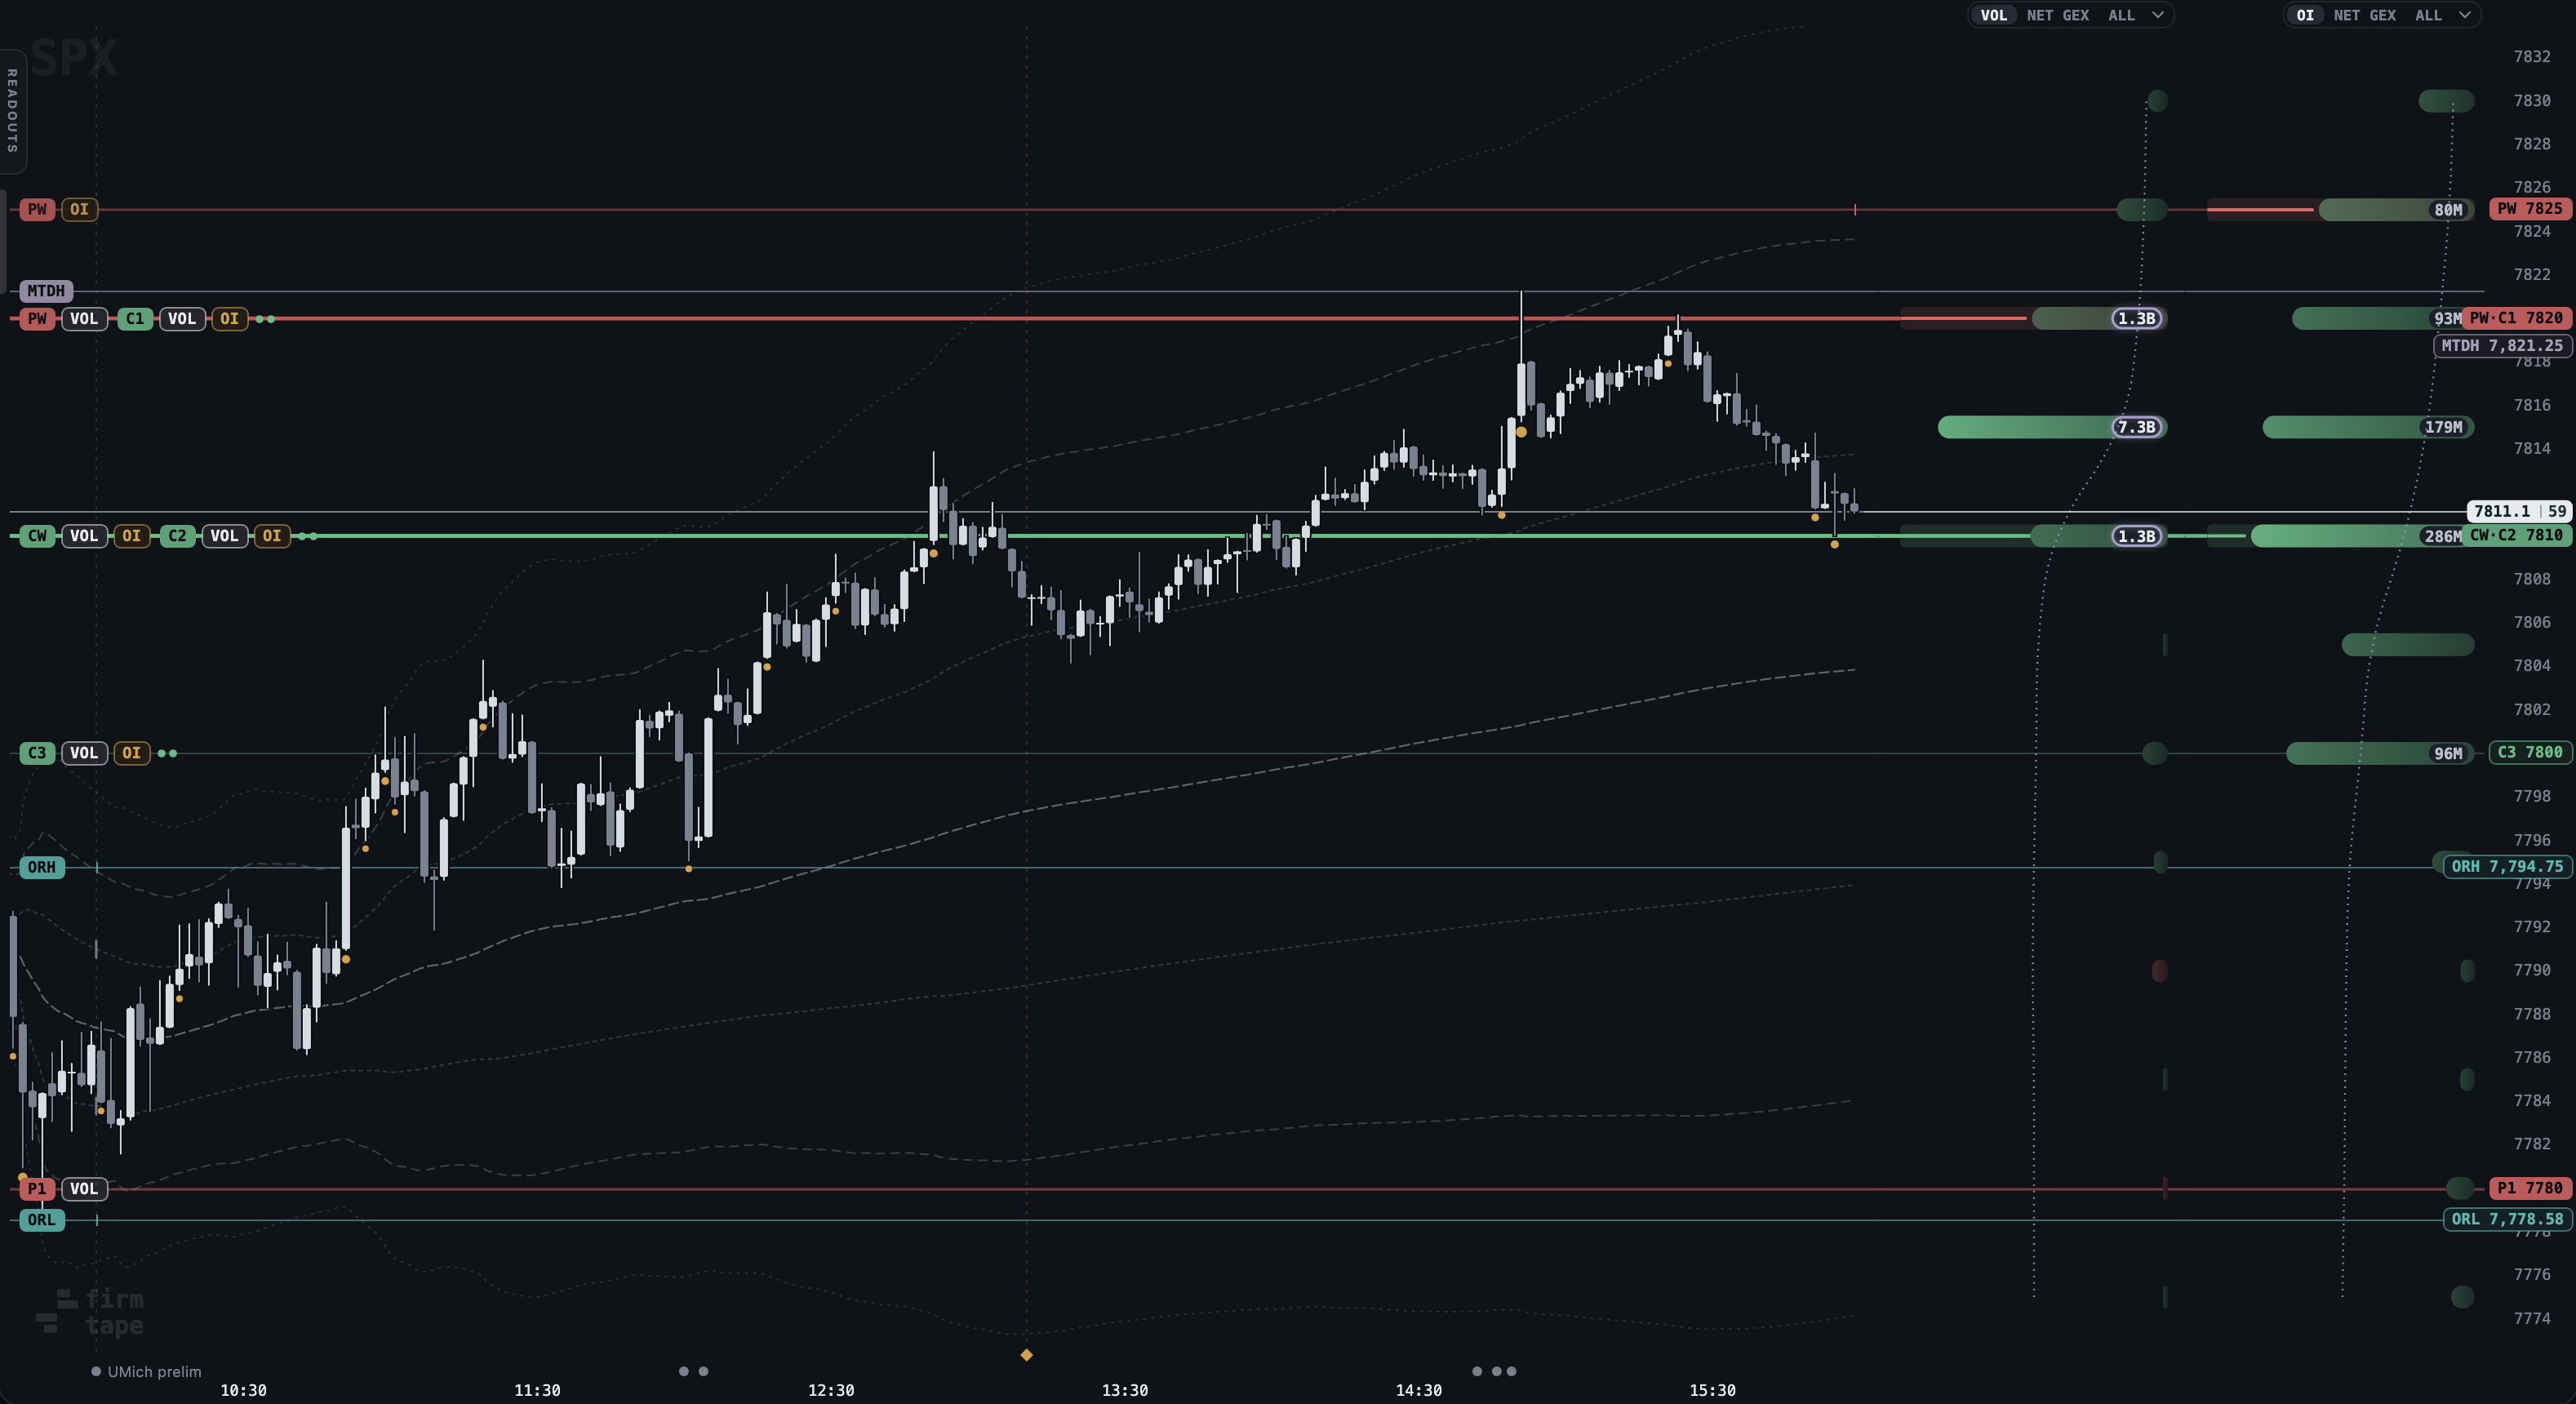
What it measures: Session levels come from prices, not from a book. The prior day's high and low are read from that session's per-second prices, so a high the replay of that day reached is the high on the line. Week and month come from the finished sessions before the day on screen; the month adds the day itself up to the cursor. Before the open the premarket chart draws them too: today's prior day, week and month, with PM and ON growing as the premarket prints.
How to read it:
- Each group has its own colour, a badge at the line's left end and a plate on the price scale. A price crossing a session level flashes it.
- When a session level lands on a wall or a level of interest they share one line and one plate naming every member, such as CW·C2·PDC 7620. The strongest kind draws the line: a wall, then a level of interest, then a session level.
- A replay draws them as they stood at its cursor.
Limits: PM is LIVE only: a replay has no premarket on its chart. On ES, NQ and RTY every session level is moved by the day's basis, the same way the view moves its dealer levels.
Related: Session levels, the full page · LIVE: Walls and levels · LIVE: PREMARKET · LIVE: LAYERS
TRAIL#
Why: which strikes the book kept rebuilding, and which were left after one touch. Where: TRAIL on the chart bar (on, dim, off). Plan: LIVE for today; free on every finished session.
- Press TRAIL once for on, again for dim, again for off.
- Read the hatched trail behind each level: thick where the book carried the strike, gaps where it did not.
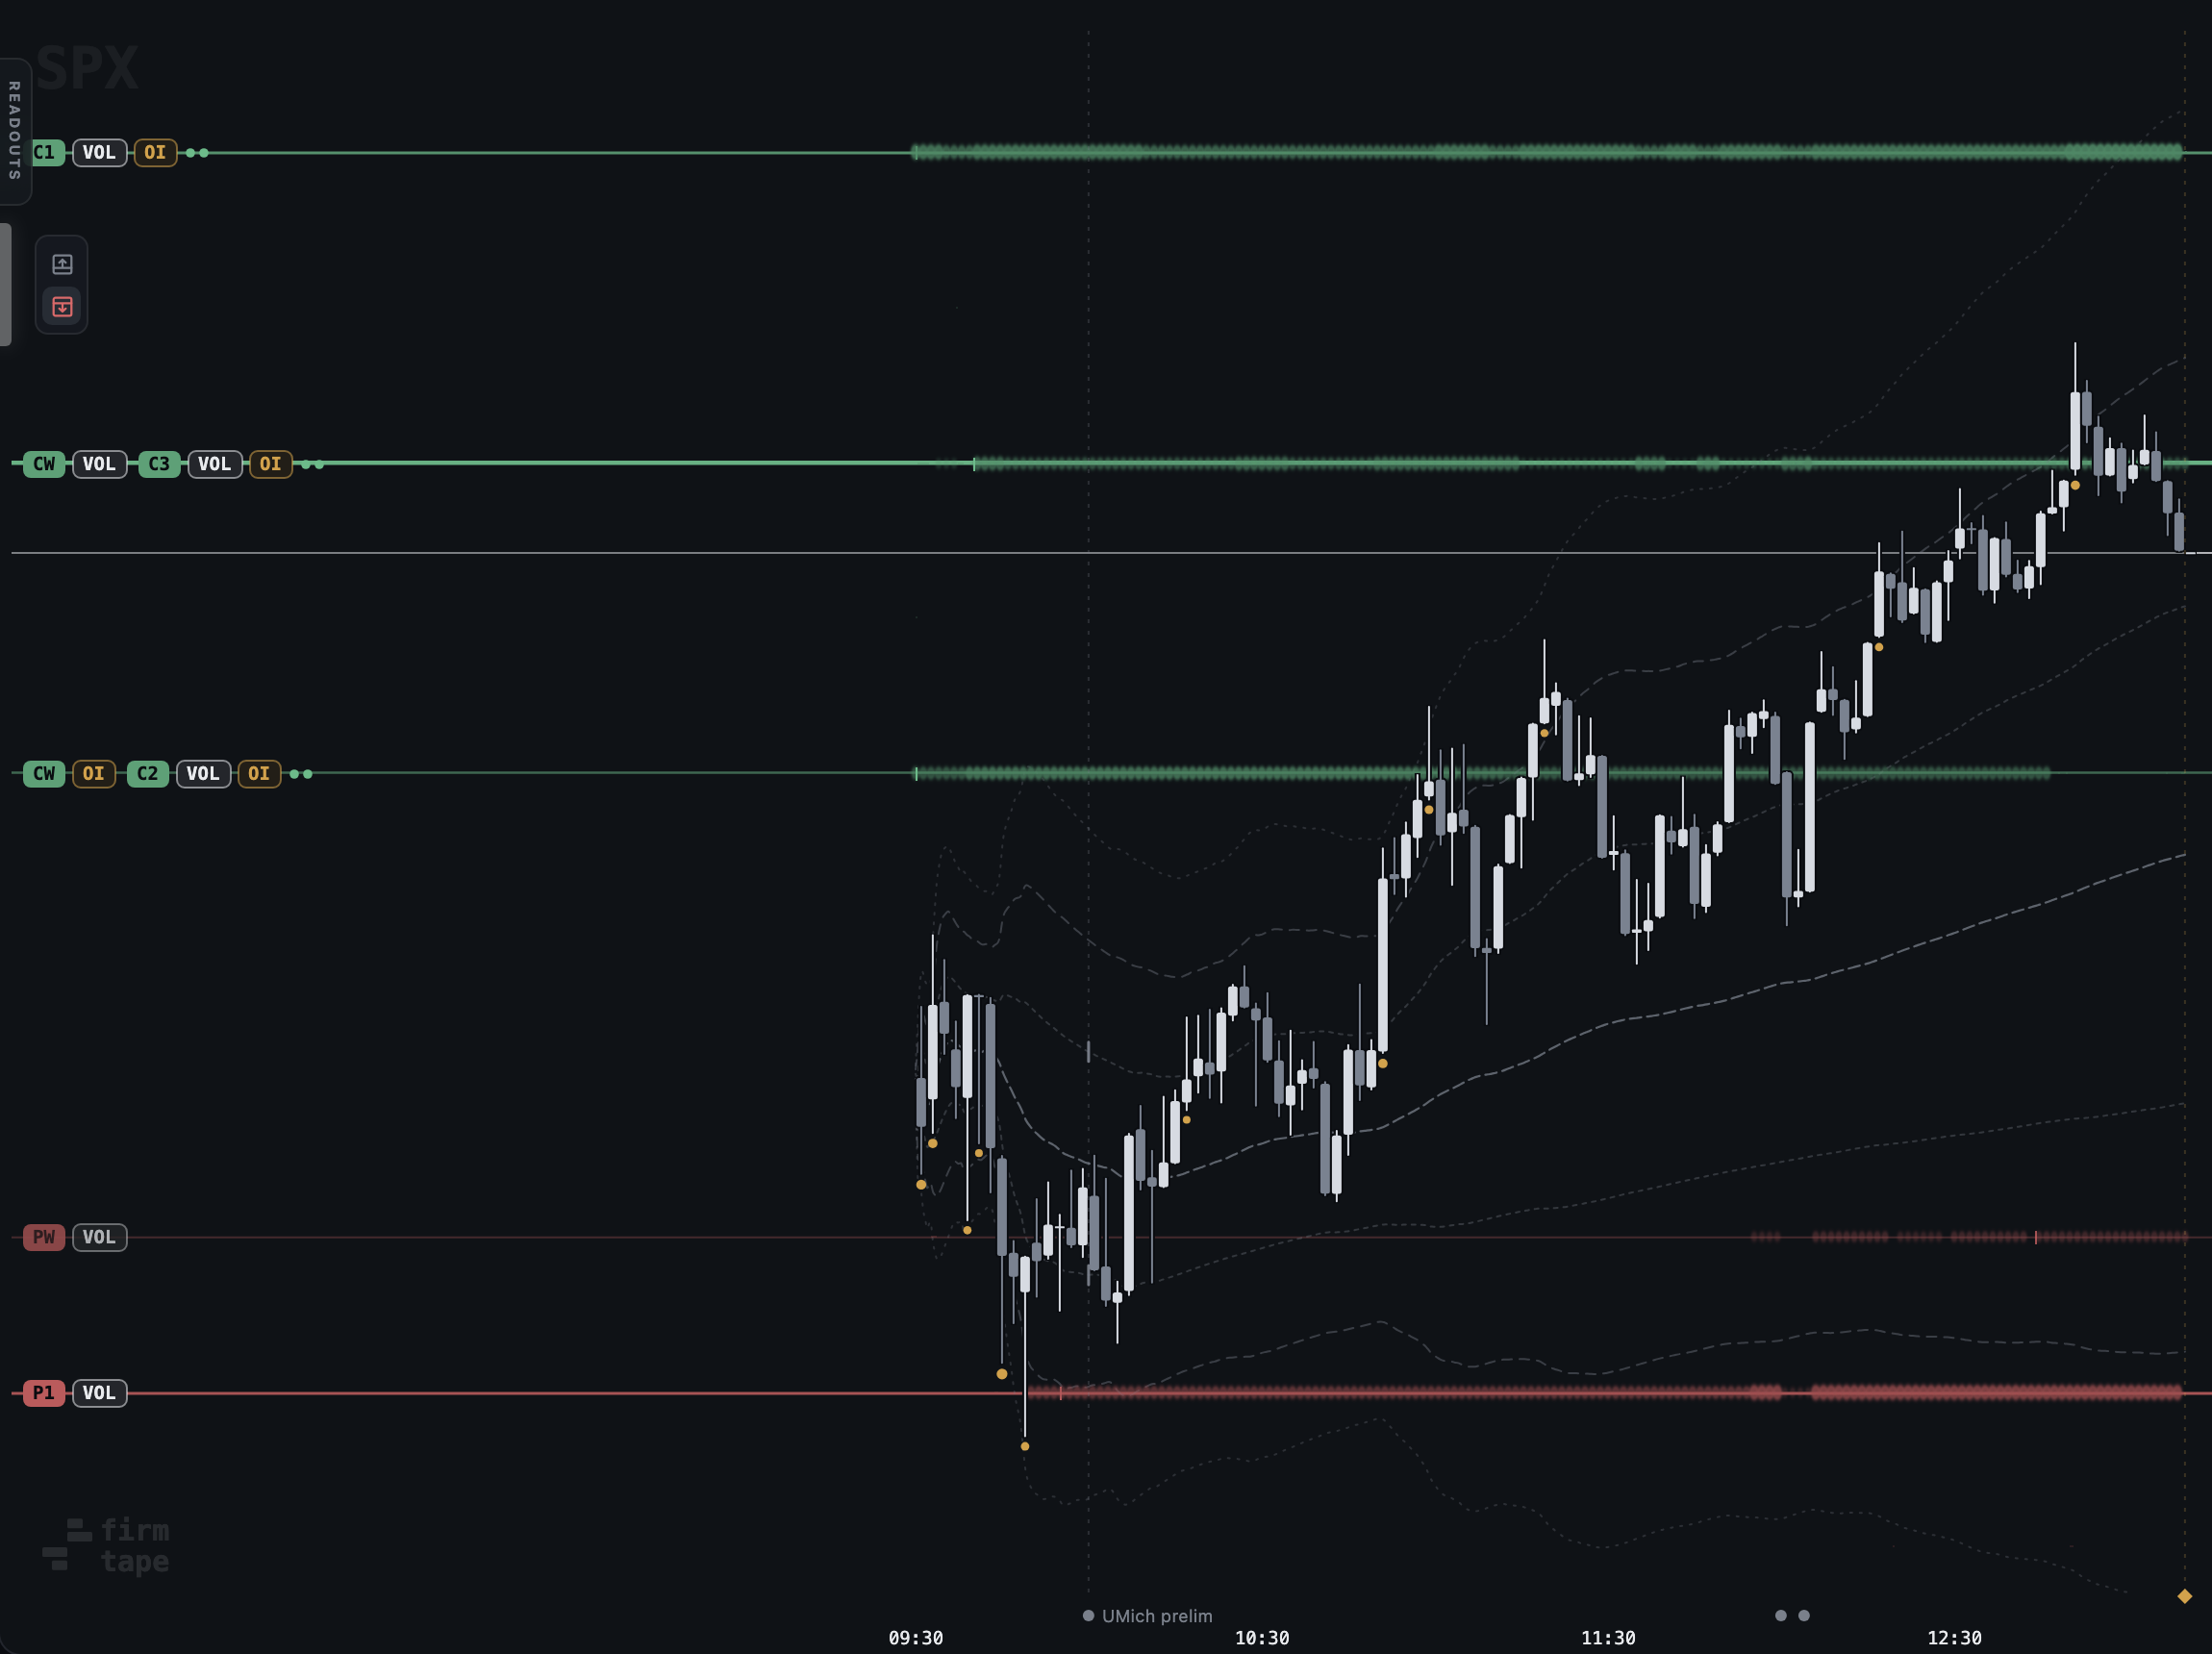
Limits: TRAIL needs the per-second grid; on a day without one it offers to build it.
Related: LIVE: Walls and levels
±σ band and event marks#
Why: the session's own stretch around its VWAP, and the releases that moved it. Where: ±σ on the chart bar. Plan: LIVE for today; free on every finished session.
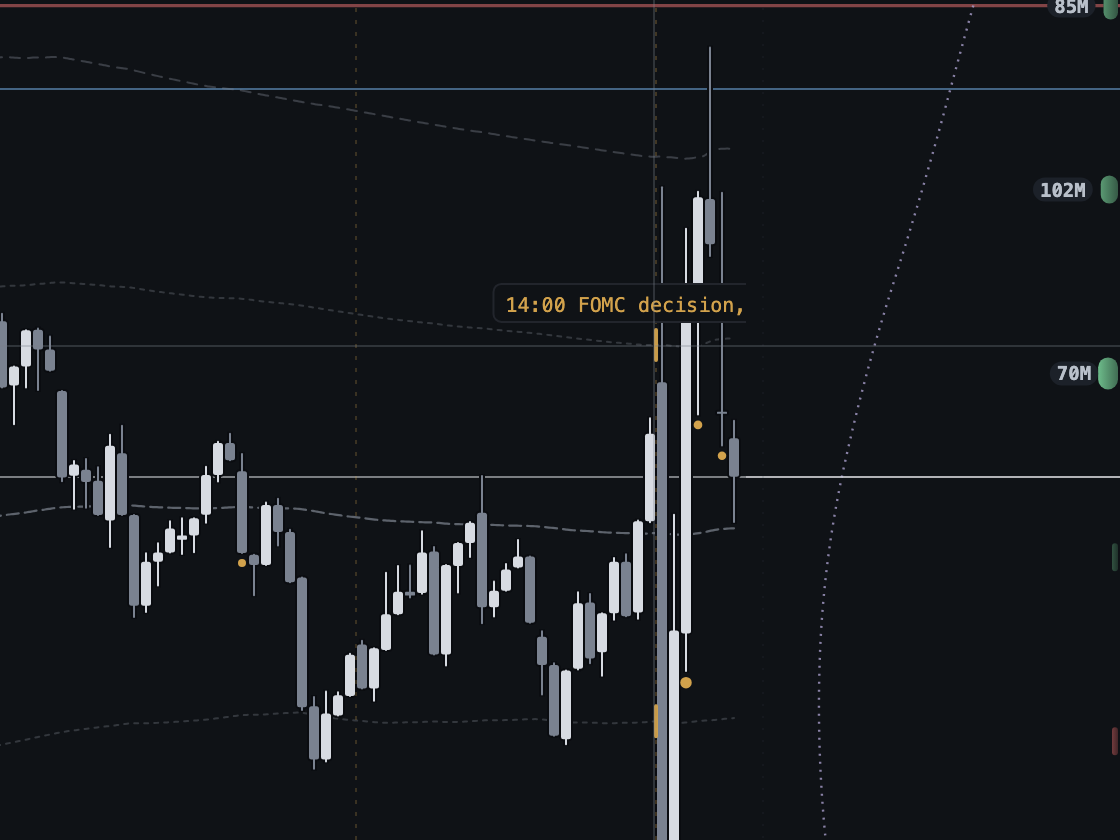
- Press ±σ to draw the session VWAP with one, two and three standard deviations of the session's prices.
- Point at a short tick on a 1σ edge to read the release it marks, for example 14:00 FOMC decision.
How to read it:
- The band measures the session's own prices, not the book.
Related: REPLAY: Market calendar and pulse
Map the surface
LAYERS#
Why: one place for everything drawn over the candles. Where: LAYERS on the chart bar; the number on it counts what is on. Plan: LIVE for today; free on every finished session.
- Click LAYERS.
- Pick rows: SESSION, LEVELS OF, OVERLAYS, HEATMAP, INDICATORS, RESEARCH, ORDERS.
- Point at any button for what it draws.
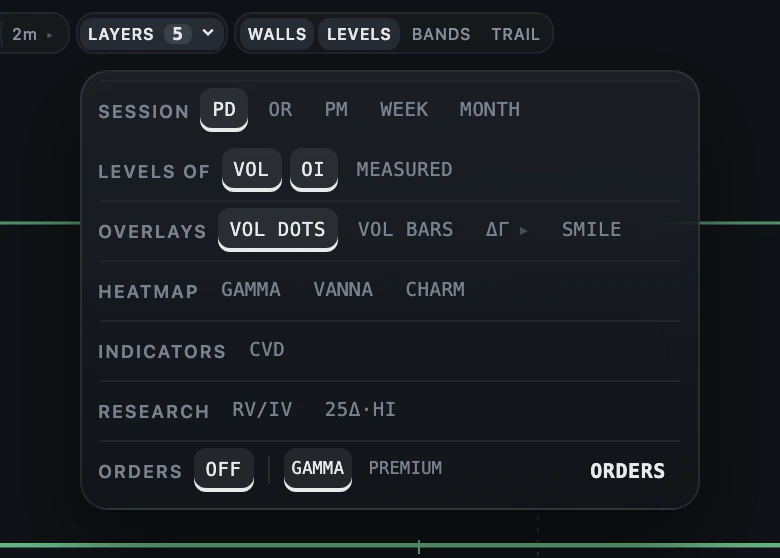
Related: LIVE: Session levels · LIVE: Heatmap: GAMMA, VANNA, CHARM · ORDERS: Orders on the chart
Heatmap: GAMMA, VANNA, CHARM#
Why: the whole session's book in one picture: where gamma sat, and how it moved, minute by minute. Where: LAYERS > HEATMAP: GAMMA, VANNA or CHARM, one at a time. Plan: LIVE for today; free on every finished session.
- Open LAYERS and pick GAMMA in the HEATMAP row.
- Read the colour behind each candle: one side of the legend for positive, the other for negative, brighter for more.
- Switch to VANNA to see how hedges move with implied vol, or CHARM for how they move with time to expiry.
- Turn walls and levels on with it to see which bright regions became levels.
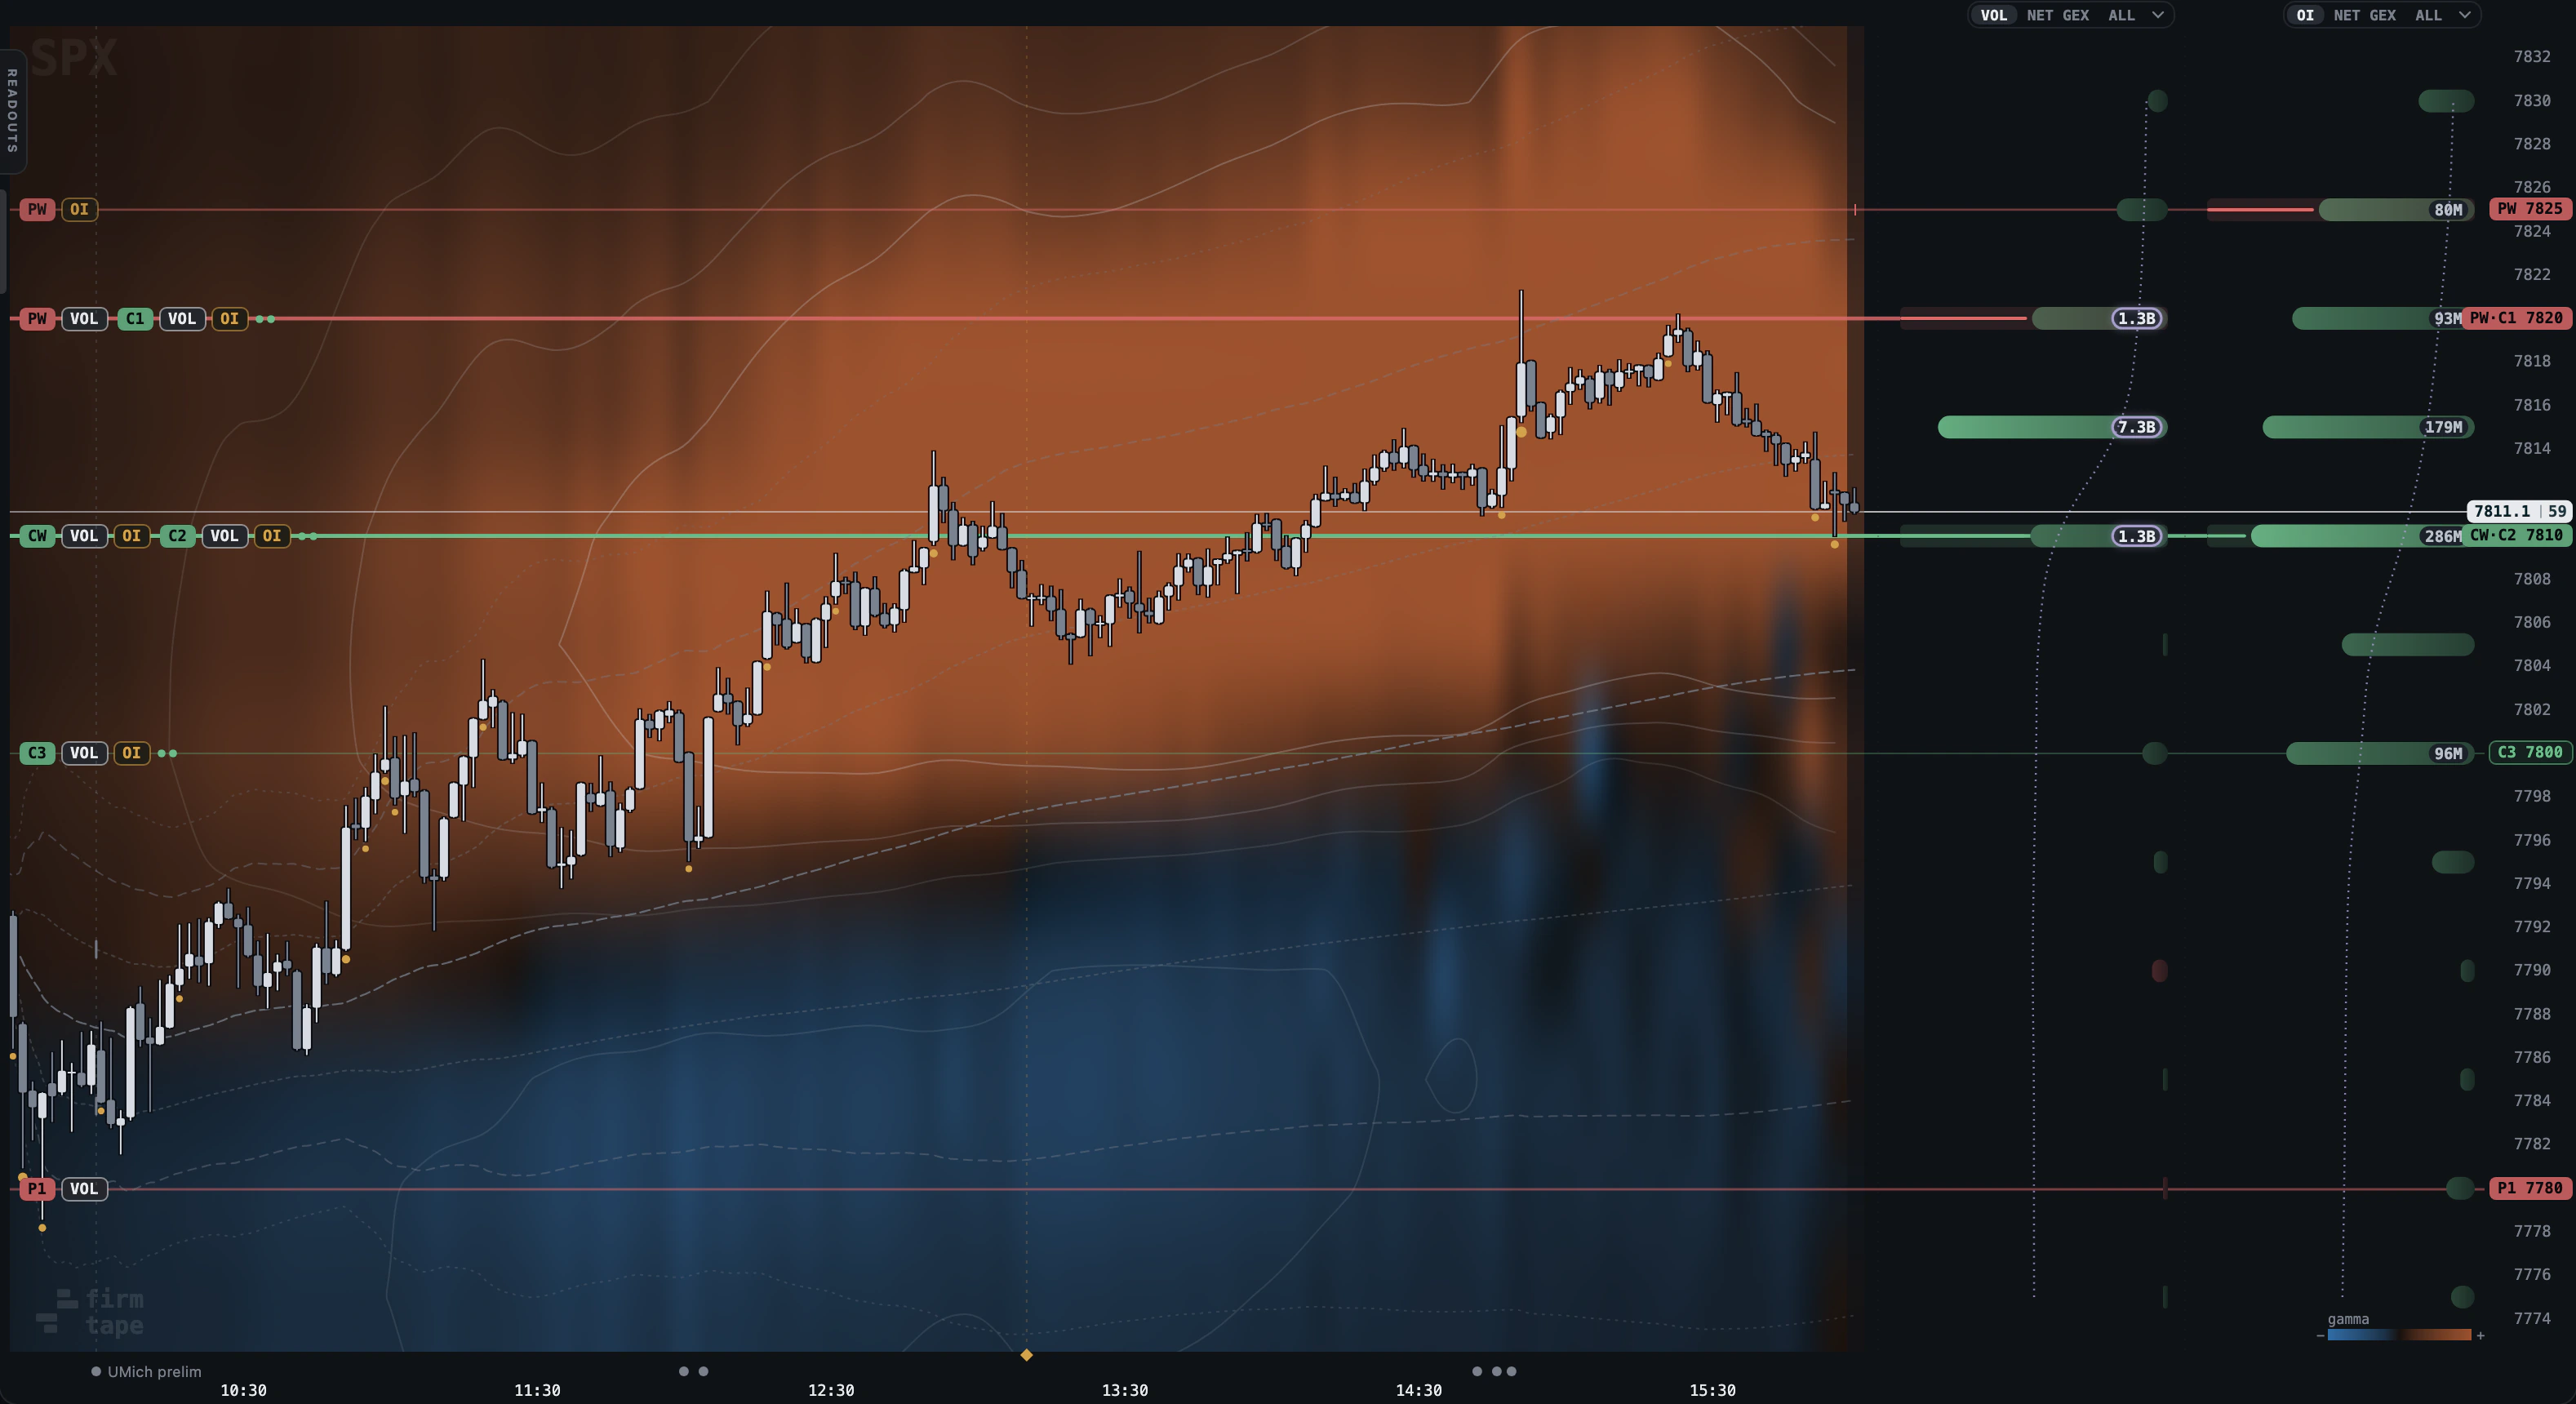
What it measures: Each cell is one strike at one minute, coloured by that greek's dealer exposure in the volume book's frames. The legend at the bottom right gives the sign of each colour.
| Control | What it does |
|---|---|
| GAMMA | Where gamma sat through the day |
| VANNA | How hedges move with implied vol |
| CHARM | How hedges move with time to expiry |
How to read it:
- Bright bands that persist are strikes the book carried all day; short flashes are flow that came and went.
- Price moving from one colour into the other is crossing between gamma regions, not a forecast.
Limits: One heatmap at a time. Tickers draw vanna and charm from the volume and open-interest books.
Related: Heatmap: GAMMA, VANNA, CHARM, the full page · LIVE: Walls and levels · LIVE: TRAIL · LIVE: The three books · Vanna and charm
VOL DOTS and VOL BARS#
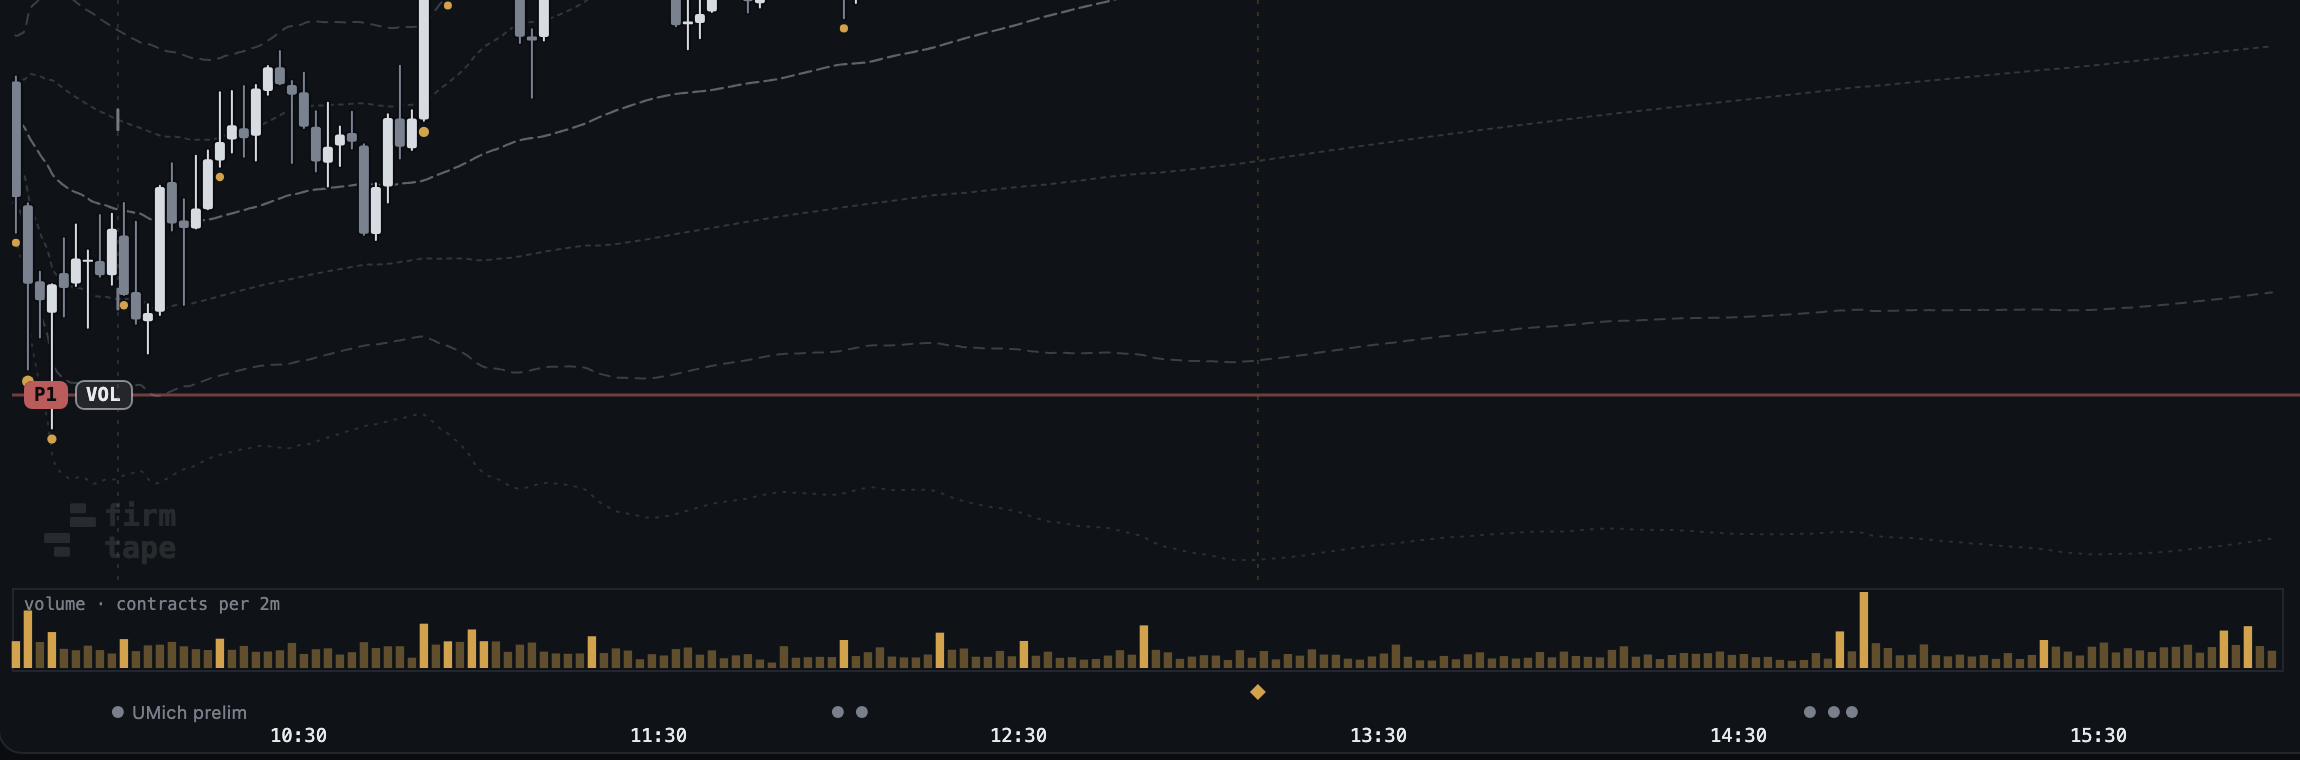
Why: where the session's traded volume landed. Where: LAYERS > OVERLAYS. Plan: LIVE for today; free on every finished session.
- VOL DOTS marks candles whose 0DTE volume is in the top tenth of the window.
- VOL BARS draws contracts per candle under the chart, the busiest bars brightened.
How to read it:
- Volume says how much traded, never which side.
Related: LIVE: CVD · LIVE: ΔΓ overlay
ΔΓ overlay#
Why: candle by candle, how the measured flow changed the book. Where: LAYERS > OVERLAYS > ΔΓ. Plan: LIVE for today; free on every finished session.
- Press ΔΓ once for a strip of bars under the chart (green added, red shed).
- Press again to write the number beside each candle; again for off.
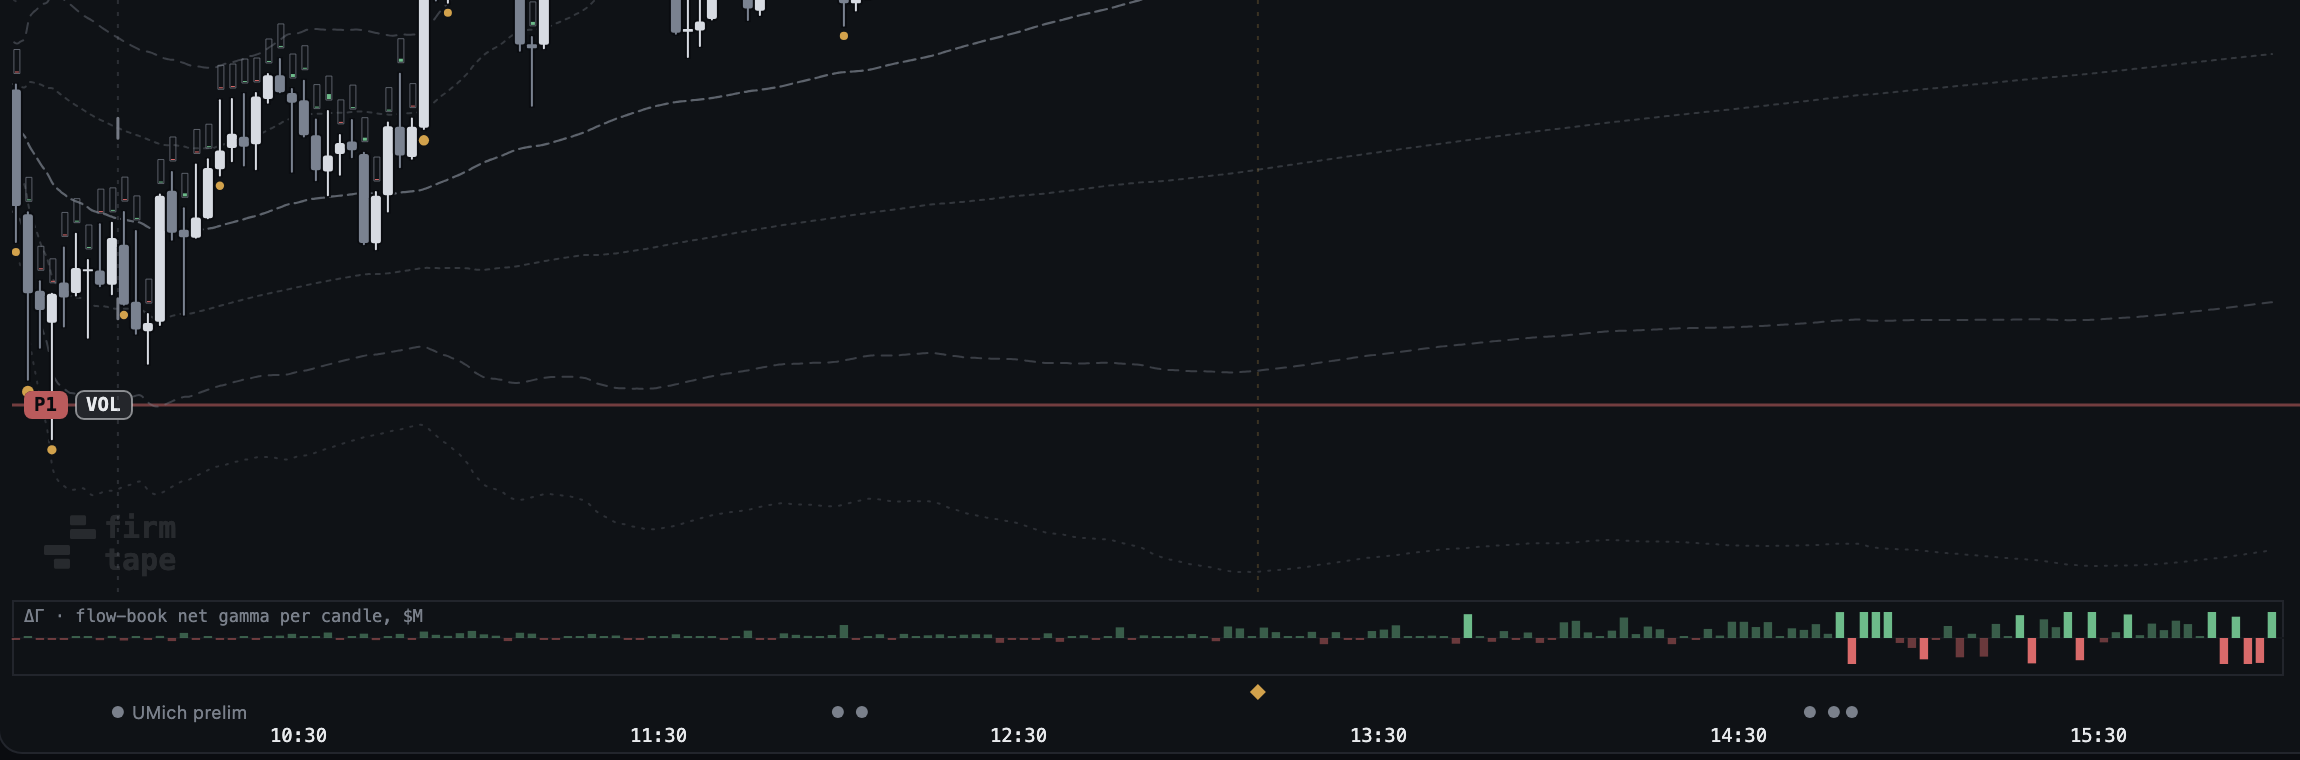
What it measures: Net dealer gamma put on while each candle formed, in the measured flow book, in $M.
Related: LIVE: READOUTS drawer · LIVE: The three books
SMILE#
Why: the volatility smile on the same strikes as the book. Where: LAYERS > OVERLAYS > SMILE. Plan: LIVE for today; free on every finished session.
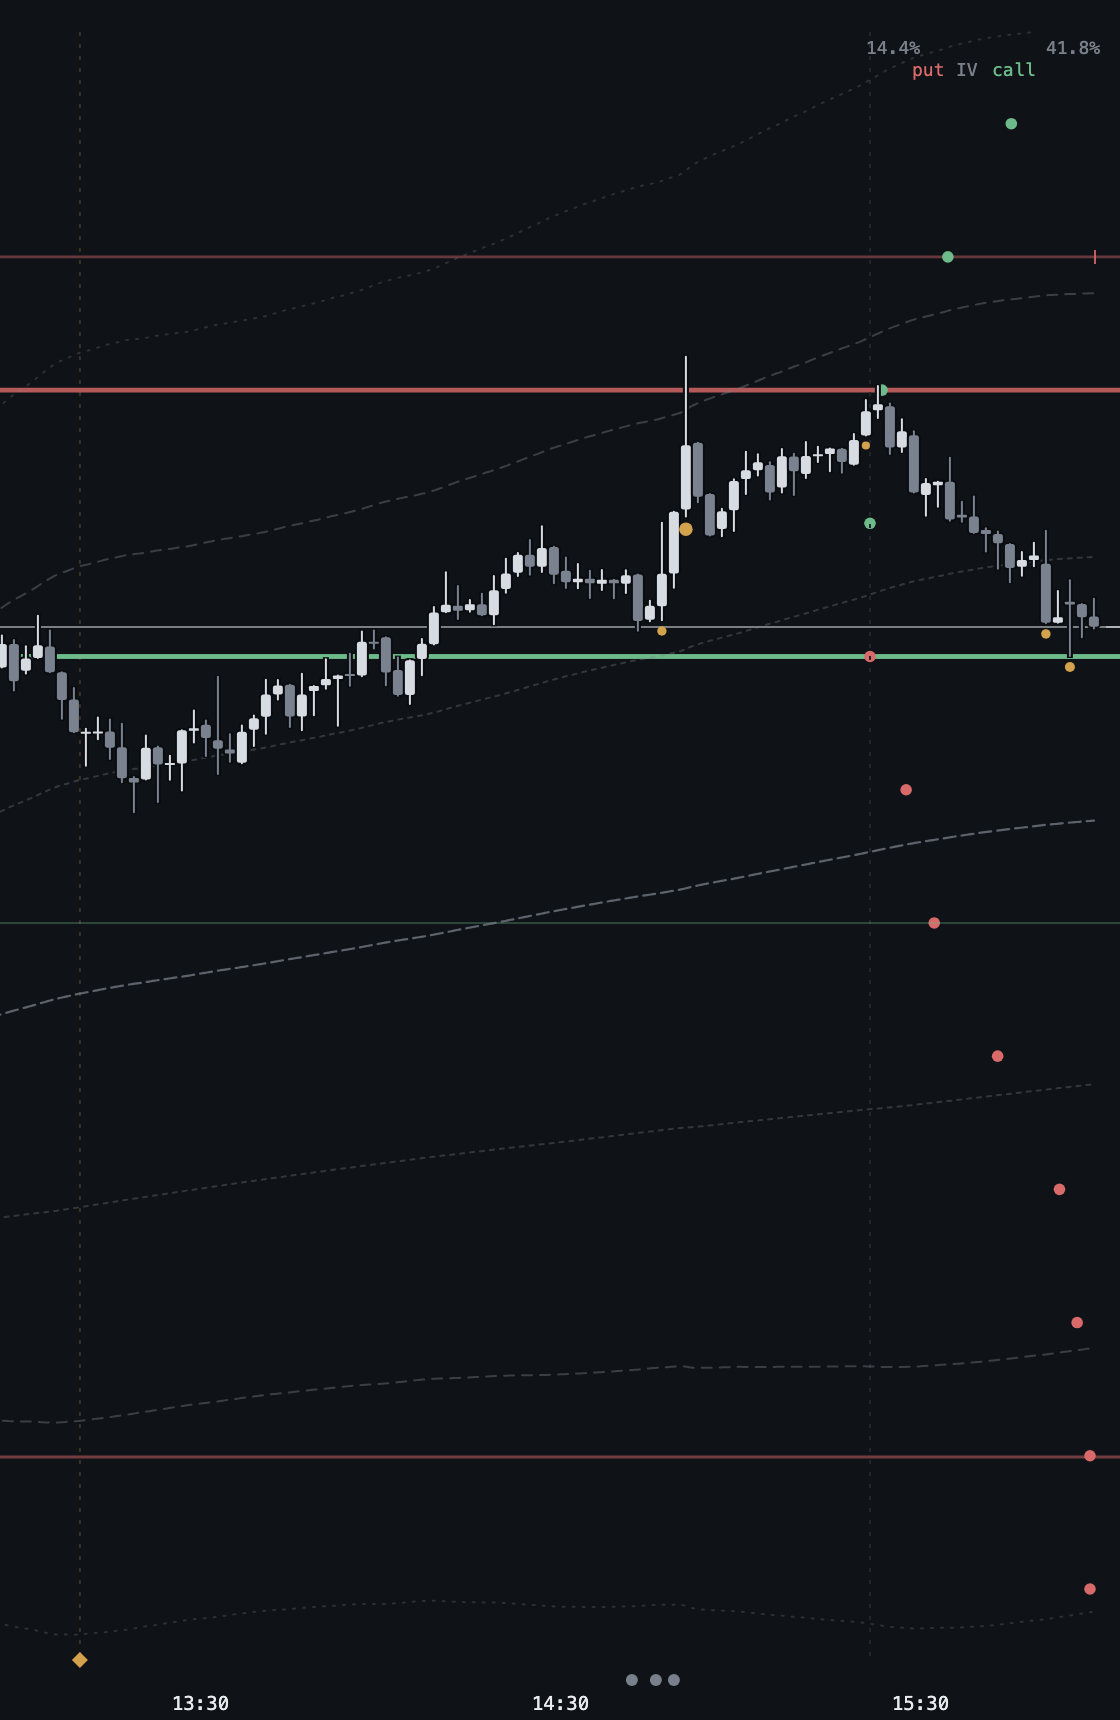
- Turn on SMILE.
- Read the dots at the right of the plot: each strike's implied vol, red for puts below spot, green for calls above, with the range written at the top.
Related: LIVE: READOUTS drawer
CVD#
Why: how the session's 0DTE volume split between calls and puts, totalled from the open. Where: LAYERS > INDICATORS > CVD. Plan: LIVE for today; free on every finished session.
- Turn on CVD: a band opens under the chart.
- Pick the expiry scope on its right: ALL, 0DTE or NEXT.
- Pick CT for contracts, and CVD or BARS for the style; the x closes it.
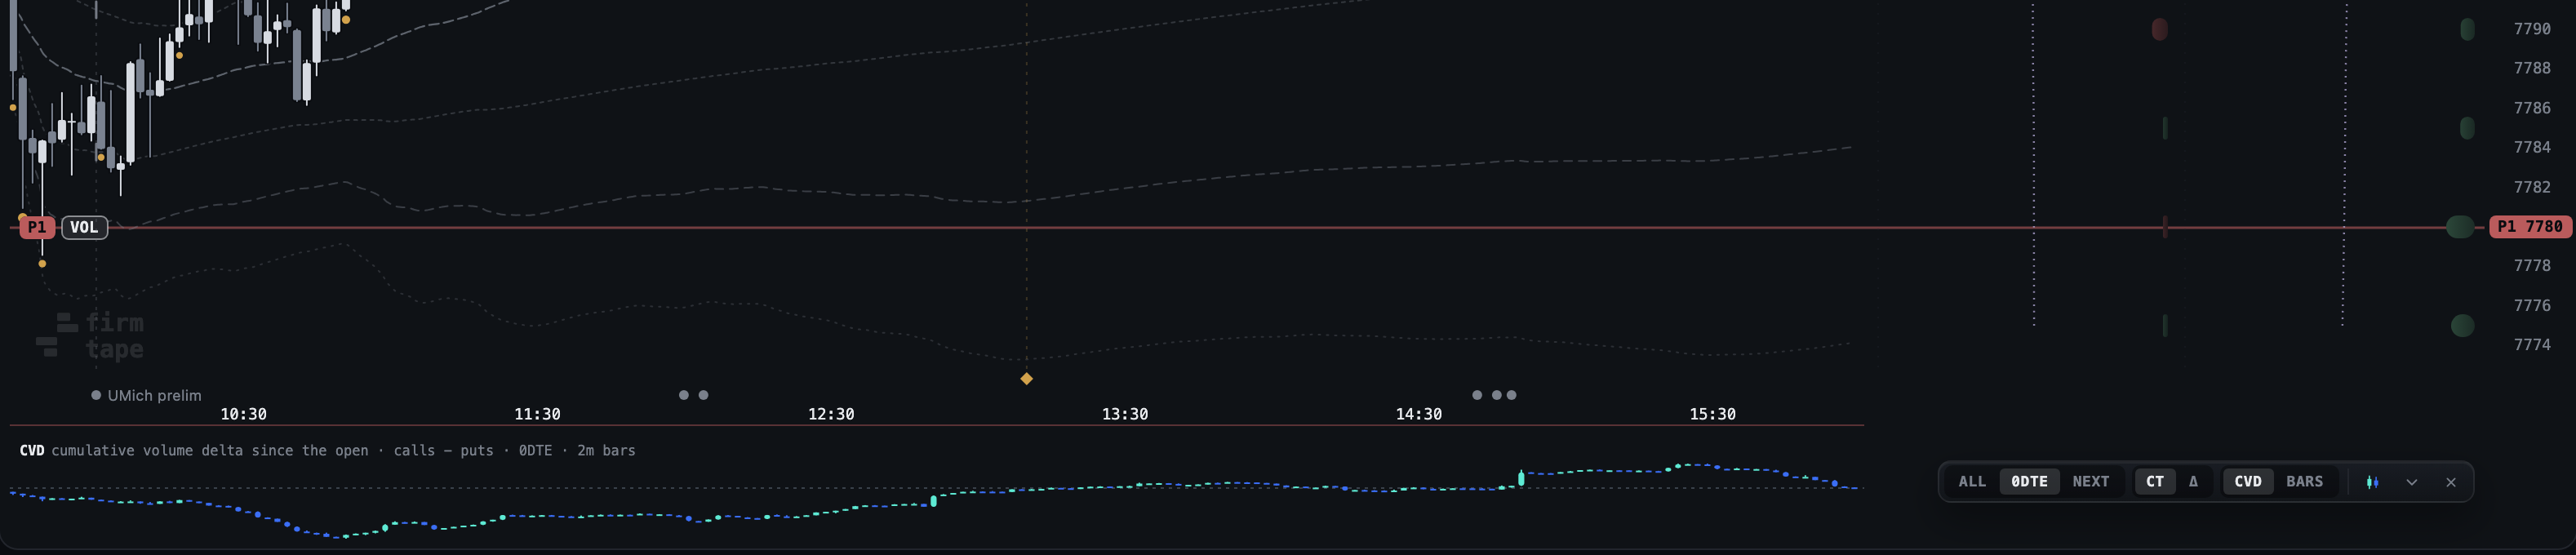
What it measures: Cumulative volume delta: call contracts minus put contracts per bar, totalled from the open.
How to read it:
- Calls minus puts counts contracts by right, not by side: a call can be opened or closed by anyone.
Related: LIVE: VOL DOTS and VOL BARS
Research overlays: RV/IV and 25Δ·HI#
Why: the strongest relationship in the whole study, drawn as it happens. Where: LAYERS > RESEARCH. Plan: LIVE for today; free on every finished session.
- Turn on RV/IV: a strip under the chart of trailing realised range over implied range, at 15, 30 or 60 minutes.
- Read 1.00 as the market having priced the move exactly; above 1 it underpriced, below 1 it overpriced.
- 25Δ·HI marks with a violet dot the candle where 25-delta skew reached the top tenth of the session so far, and shades the 30 minutes after it.

What it measures: Realised over implied is the strongest relationship in the study (coefficient +0.49, day-clustered t +12.8, deciles running 0.70 to 1.35).
How to read it:
- It does not pay on its own. The naked round trip fails because implied vol moves against you by almost exactly as much as you gain: at 60 minutes the underlying leg runs from minus $213 to plus $324 across deciles while the IV leg runs from plus $115 to minus $130. Hedging removes delta, not vega.
Limits: Research layers: measurements to test in LAB, not rules.
Related: LIVE: The expected move · LAB: The LAB desk and the backtest
FORWARD#
Why: how the current book reprices toward the close, drawn beside the price. Where: FORWARD on the chart bar. Plan: LIVE for today; free on every finished session.
- Press FORWARD.
- Read the cone: one expected move to each checkpoint.
- Read the heavy strikes with their share of the near-money window.
- Read the white path, labelled model, not a forecast.
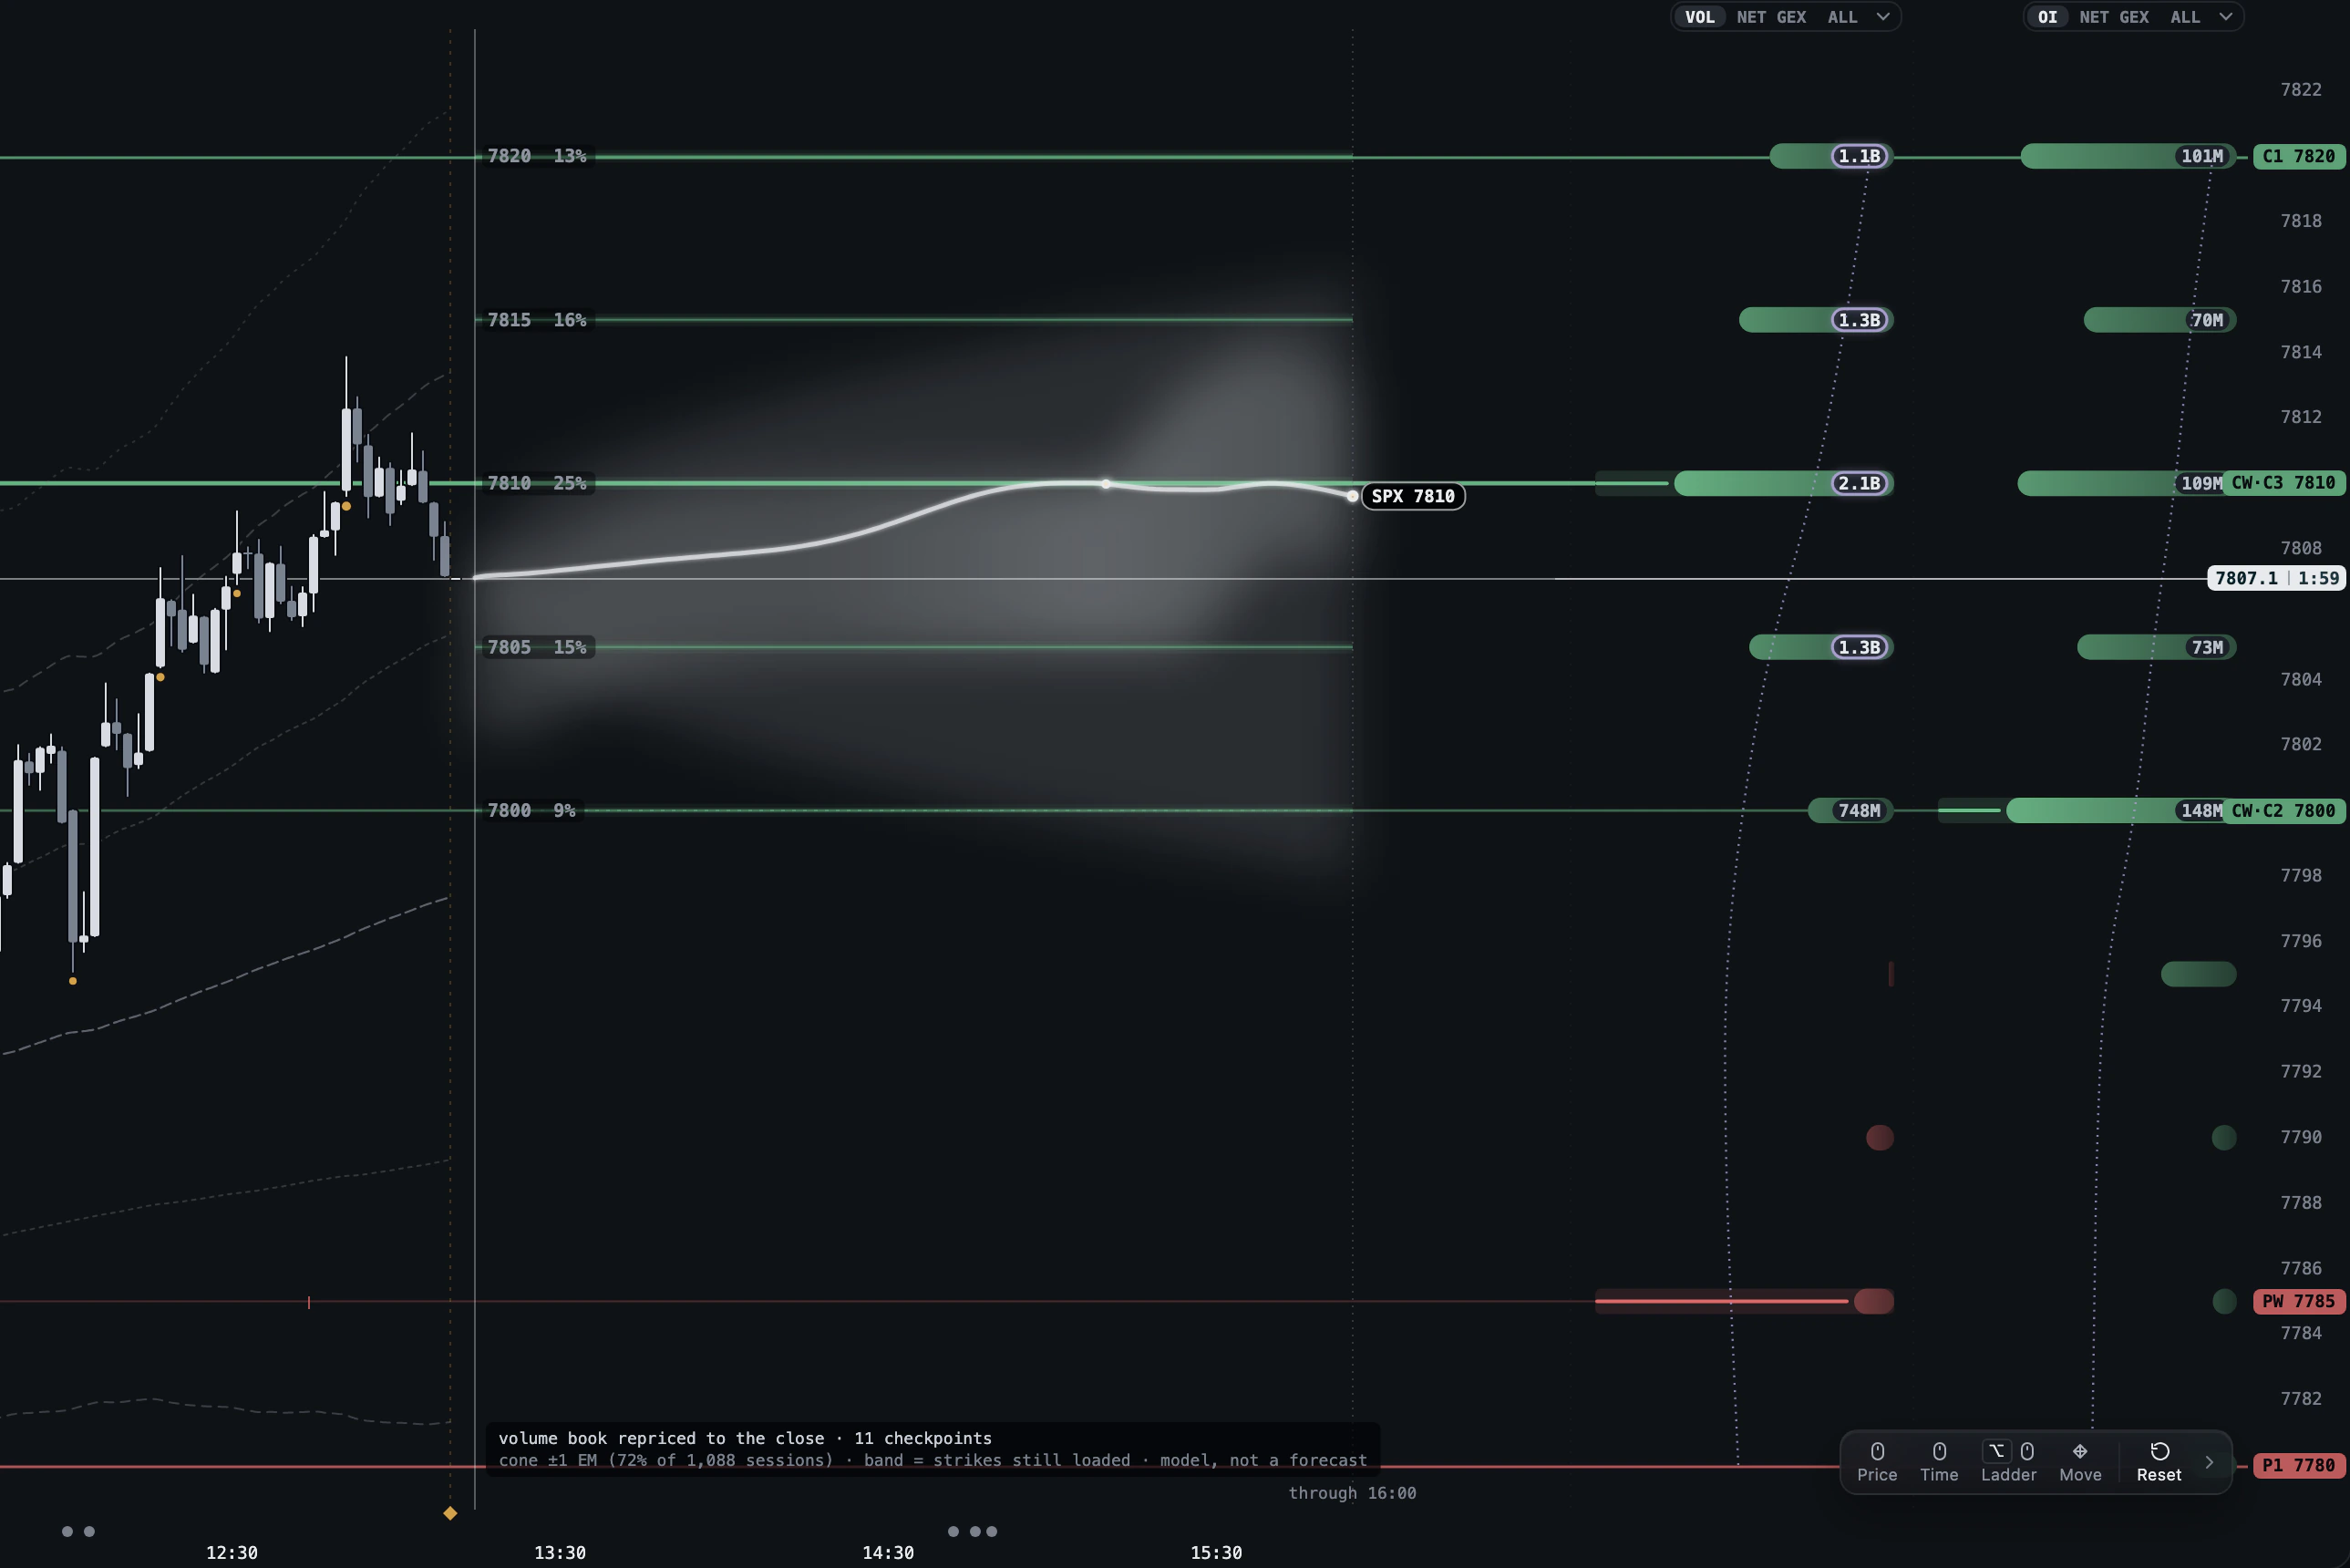
What it measures: The book on screen repriced at future clocks: the volume book carried to the close over eleven checkpoints. The band shows the strikes still loaded.
How to read it:
- The path is a model of the book carried forward, not a forecast of price.
Related: LIVE: The expected move · LIVE: COMPARE
COMPARE#
Why: how other symbols' books carry forward, side by side on one scale. Where: COMPARE on the chart bar. Plan: LIVE for today; free on every finished session.
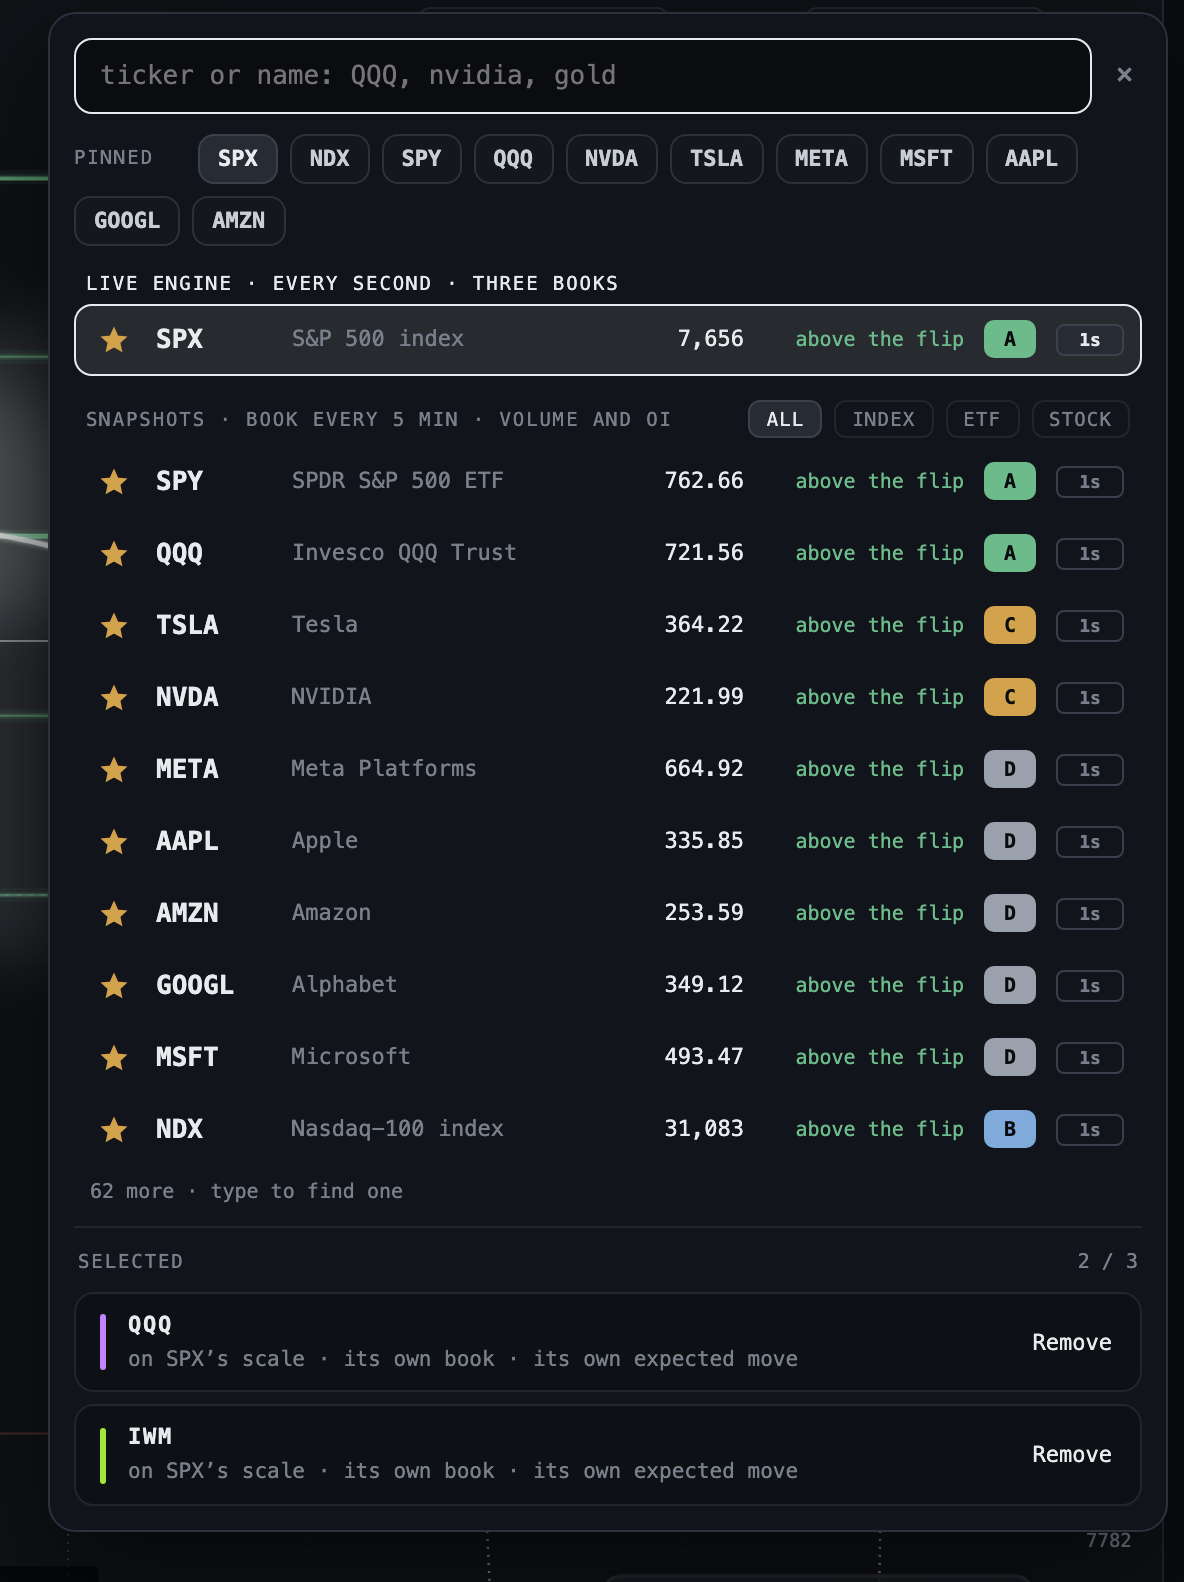
- Press COMPARE, type or pick a symbol and press enter.
- Each one appears under SELECTED with its colour and a Remove button.
- The paths draw over FORWARD, each as a percentage of its own spot; the count shows on the button.
Related: LIVE: FORWARD · LIVE: Symbol picker
Before the bell
PREMARKET#
Why: the market's position against yesterday's flip and walls before the index trades. Where: LIVE from 04:00 ET until the open: the PREMARKET drawer above READOUTS, and the premarket candles left of 09:30. Plan: LIVE only.
- Open the terminal in LIVE from 04:00 ET: the PREMARKET drawer opens above READOUTS for the market on the chart.
- Read the estimate: where the market stands now and its change against the close, with the source and how old it is.
- Read the levels: yesterday's flip, call wall and put wall, each with the signed distance from the estimate, in the market's own points.
- Read ATR used: how much of the average daily range the move since the close has used.
- Pan the chart left: the premarket from 20:00 ET the evening before sits in 5-minute candles left of 09:30. LAYERS > SESSION > PM draws its high and low.
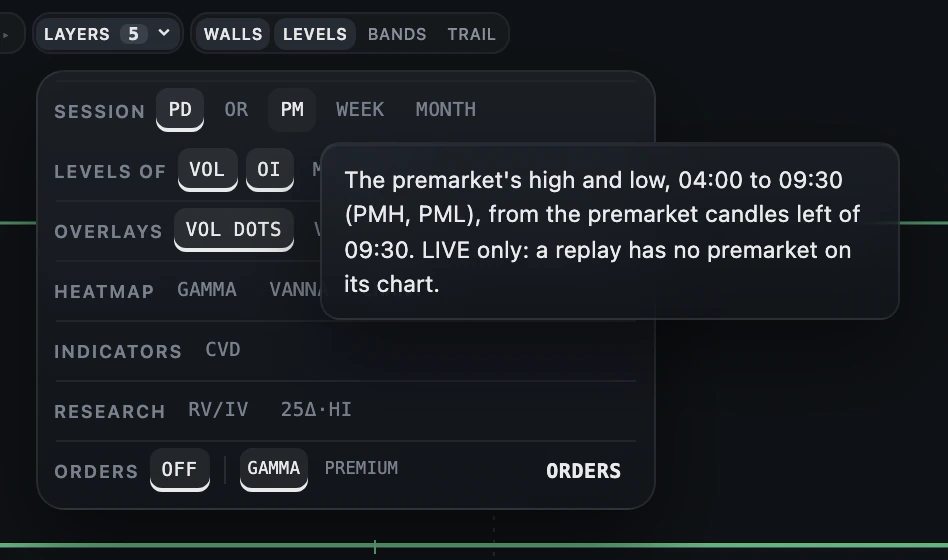
What it measures: The index does not trade yet, so its price is an estimate: the live price of a stand-in ETF times yesterday's closing ratio between the two. SPX and ES come from SPY, NQ from QQQ, gold (GC) from GLD and crude (CL) from USO; ES and NQ then go through the basis measured from the index options, and on the morning a stock goes ex-dividend the dividend is added back. A ticker shows its own price; an index goes through its ETF (NDX via QQQ, RUT via IWM).
| Control | What it does |
|---|---|
| the estimate | Where the market stands now, its change against the close, the source and its age |
| the levels | Yesterday's flip, call wall and put wall with the signed distance from the estimate |
| ATR used | The move since the close against the mean true range of the last 14 sessions, with the night's range |
| releases | The morning's scheduled releases before 09:30 marked on the premarket charts |
| the chart | Premarket from 20:00 ET in 5-minute candles, left of 09:30 on the same time axis |
How to read it:
- Every number says est. or, for a ticker's own price, ref.: none is an official print.
- A jump is read against its cause: an 8:30 CPI or payrolls is marked.
Limits: Part of LIVE, and on the screen only: no file, API, alert or ASK answer carries a premarket number. A replay has no premarket.
Related: PREMARKET, the full page · LIVE: Session levels · LIVE: Futures views: ES, NQ, RTY, GC, SI, ZB, CL · LIVE: Morning levels mail
Lay it out
PANELS#
Why: several books side by side, each with its own symbol and settings. Where: PANELS 1, 2, 3 or + PANEL in the top bar. Plan: LIVE for today; free on every finished session.
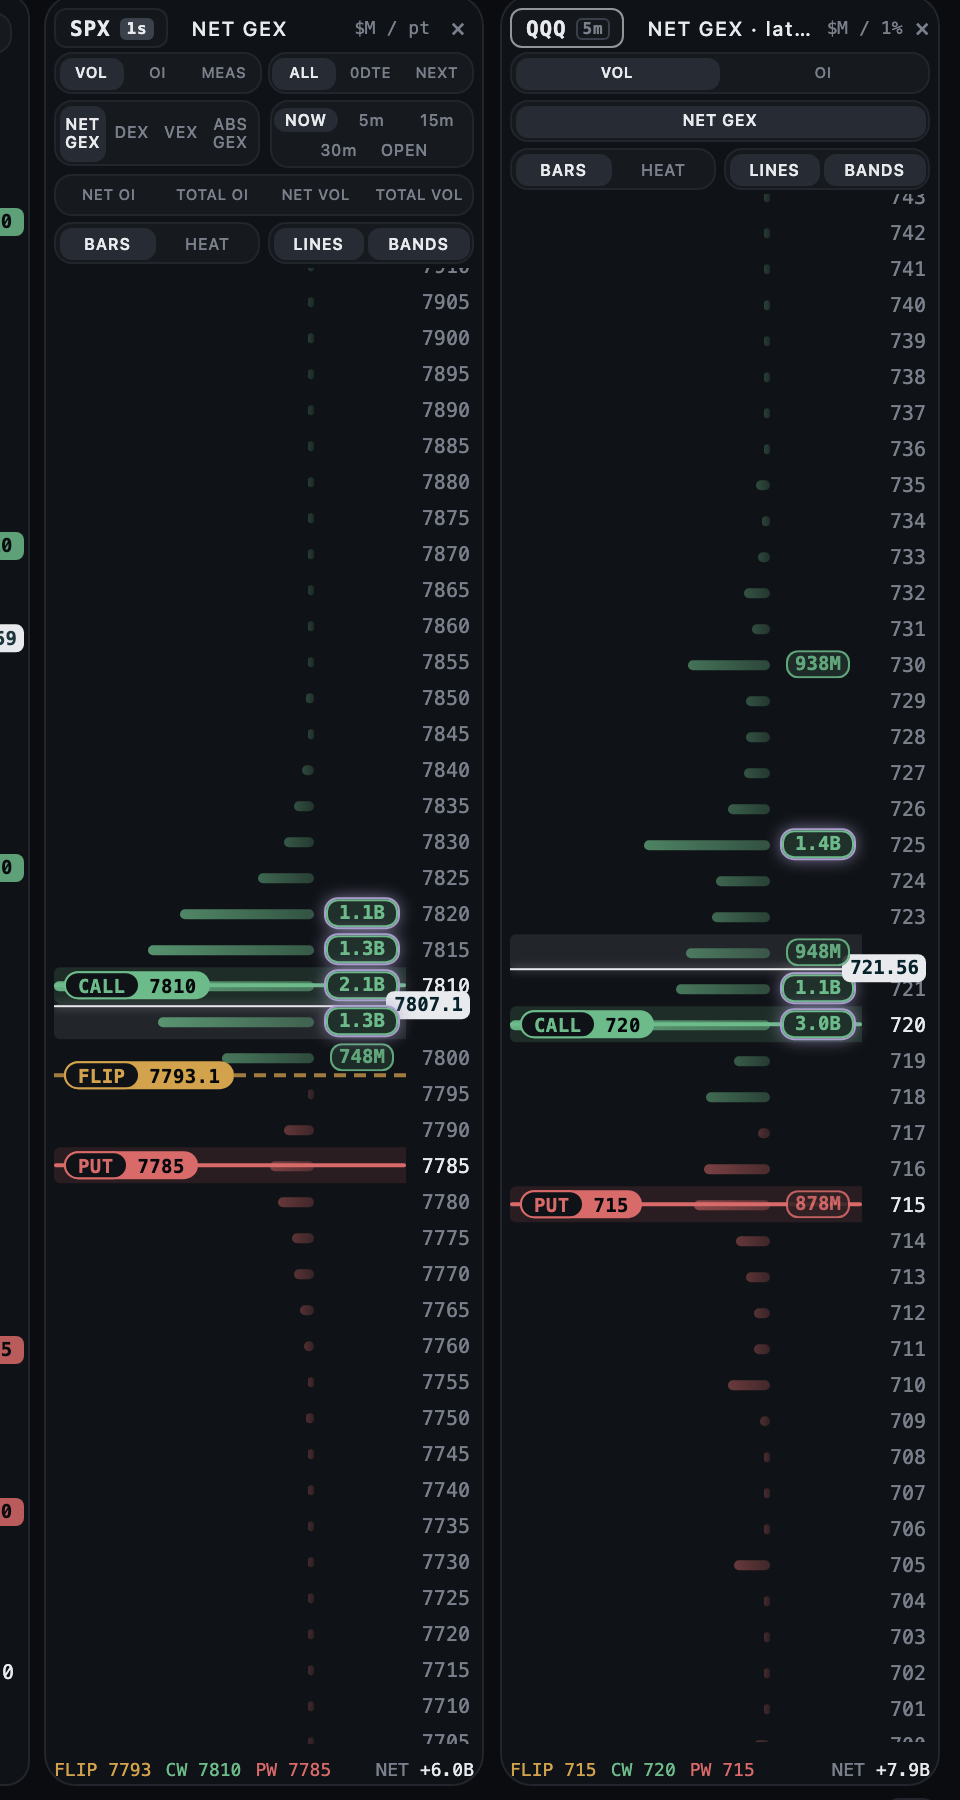
- Press PANELS 1, 2 or 3, or + PANEL for one more, up to twelve.
- Click a panel's symbol chip to change its ticker; empty means it follows the chart.
- Set each panel like a ladder column: book, expiry, metric, window, bars or heat.
- Read FLIP, CW, PW and NET at the panel's foot; CHART in the bar hides or shows the main chart.
Related: LIVE: Ladder columns · LIVE: Chart layouts
Chart layouts#
Why: several symbols, each with its own switches, playing on one clock. Where: the layout icon at the top right; ⌥1 to ⌥6. Plan: LIVE for today; free on every finished session.
- Click the layout icon at the top right.
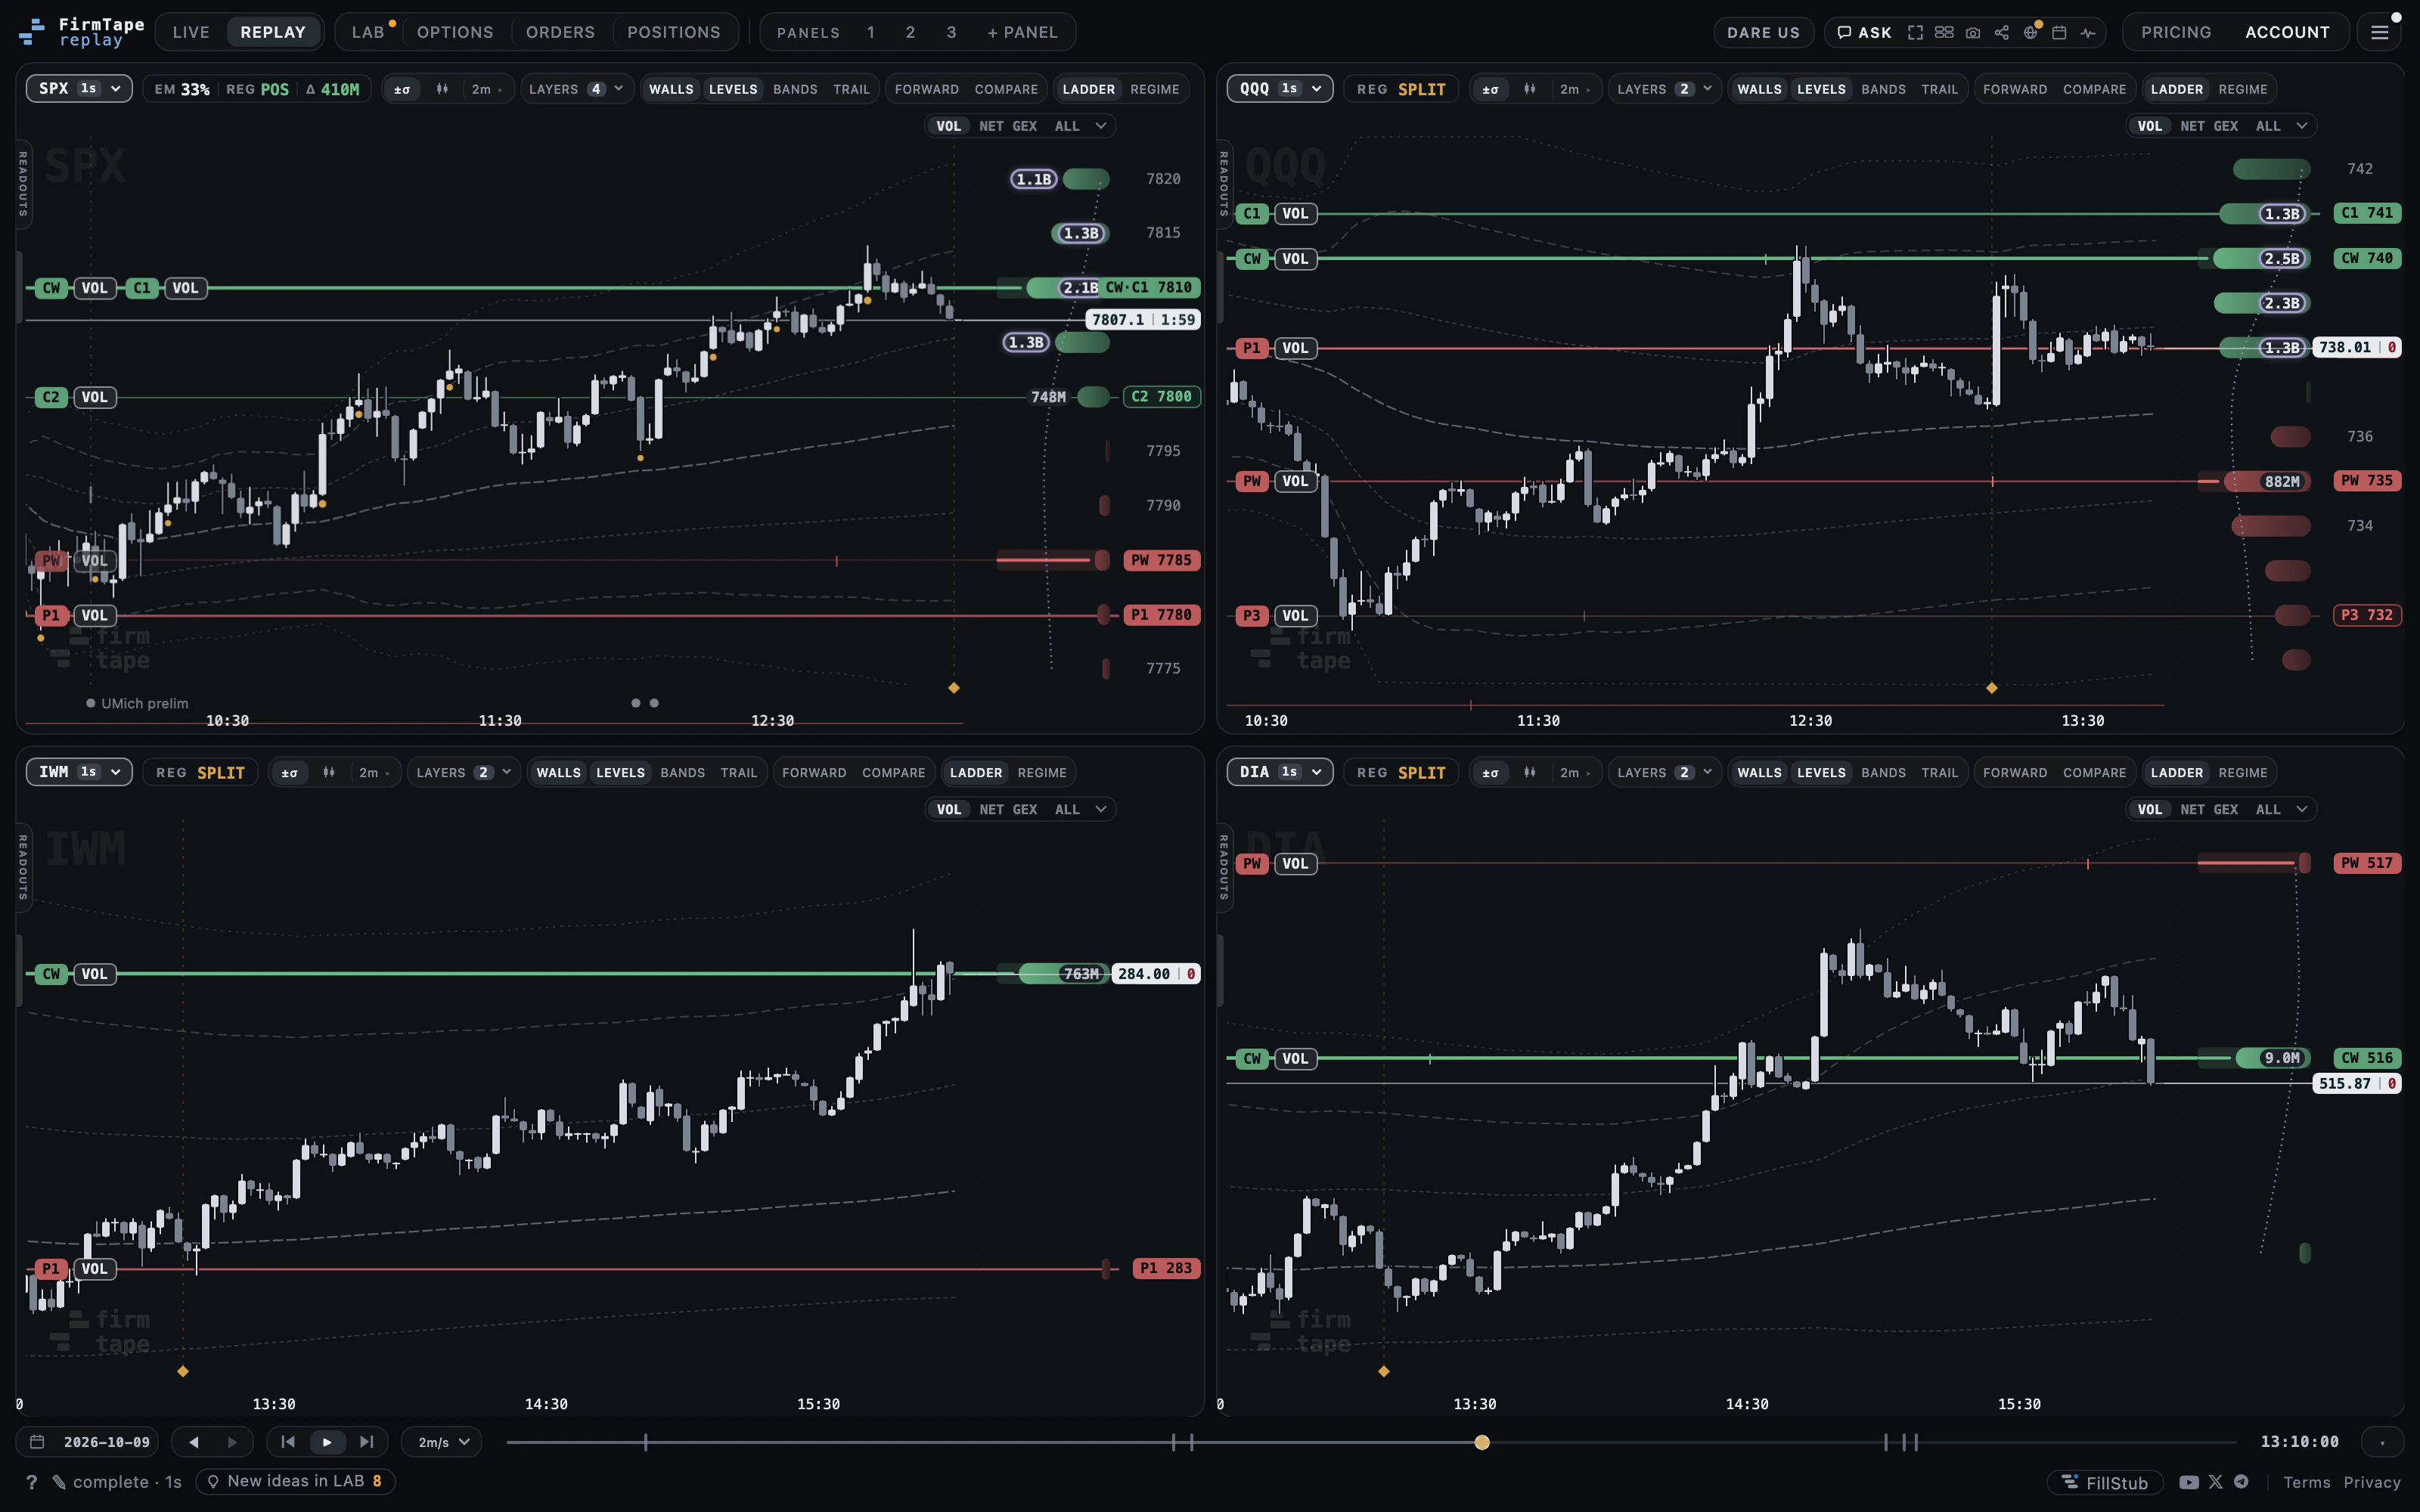
- Pick an arrangement: Single, 2-Up, 2-Stack, 3-Up, 3-Stack, 4-Up (⌥1 to ⌥6).
- Or pick a preset: Index quad (SPX, QQQ, IWM, DIA), Semis, Risk gauges (SPX, UVXY, TLT, GLD), Commodities and more.
- Each pane keeps its own symbol chip, layers and ladder, and follows the page's day and minute.
How to read it:
- When you are signed in, your arrangement (the grid and its tickers, panels, columns, display settings) is kept with your account, so it follows you to another device; the newer copy wins.
Limits: Up to four charts in one layout.
Related: LIVE: PANELS · LIVE: Symbol picker · REPLAY: Share a link to a view
Symbol picker#
Why: the same chart and controls for every symbol, with how often its book is rebuilt. Where: the symbol chip, or start typing a ticker anywhere. Plan: LIVE for today; free on every finished session.
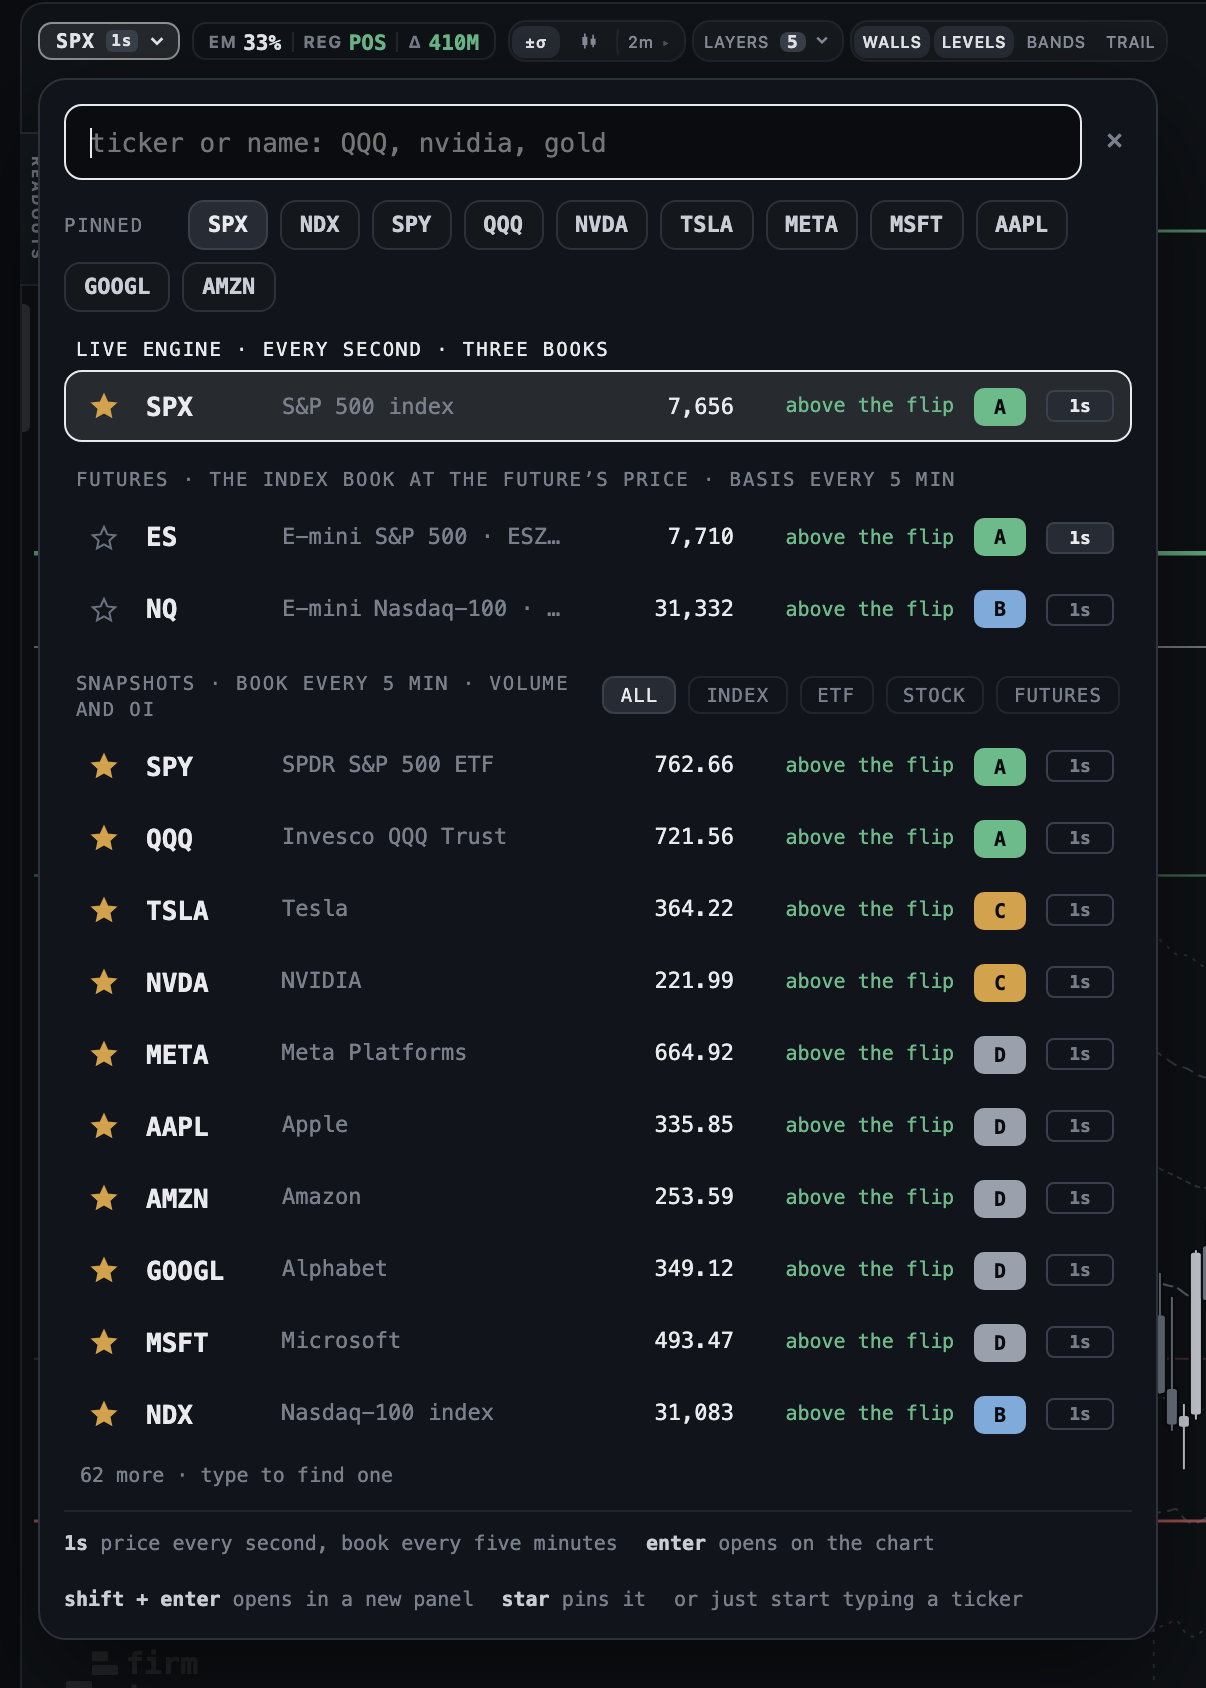
- Click the symbol chip, or just start typing a ticker; the list opens on it.
- Read the sections: SPX (live engine, every second, three books), the futures, and the snapshot tickers (volume and OI books every five minutes), each with its price, its side of the flip and a trust grade.
- Filter with INDEX, ETF, STOCK or FUTURES, or search by name (semi, gold).
- enter opens it on the chart, shift+enter in a new panel; the star pins it.
What it measures: SPX is measured every second in three books. More than a hundred more symbols are carried from snapshots of the option chain every five minutes with the volume and open-interest books, the flip and the walls. What a snapshot cannot measure is absent rather than faked: no measured book, no DEX or VEX, no hold band.
How to read it:
- The badge on the chip says how often its book is rebuilt: 1s or 5m.
- A stock shows its next earnings date on the chart.
Limits: A symbol's history starts the day it was added, in September 2026, and grows by one session every evening. LAB runs on SPX only.
Related: LIVE: Futures views: ES, NQ, RTY, GC, SI, ZB, CL · REPLAY: Gamma by symbol · LIVE: PANELS
Futures views: ES, NQ, RTY, GC, SI, ZB, CL#
Why: the levels in the points you actually chart, with no futures exchange data. Where: the symbol picker's FUTURES section, or type ES, NQ, RTY, MES, MNQ or M2K. Plan: LIVE for today; free on every finished session.
- Pick FUTURES in the symbol picker, or type the symbol; the micros trade the same prices.
- Point at the symbol chip to read the contract and today's basis or ratio.
- Read the READOUTS book section: it opens with the contract and the basis, for example ESZ26 from the SPX book, basis +58.50.
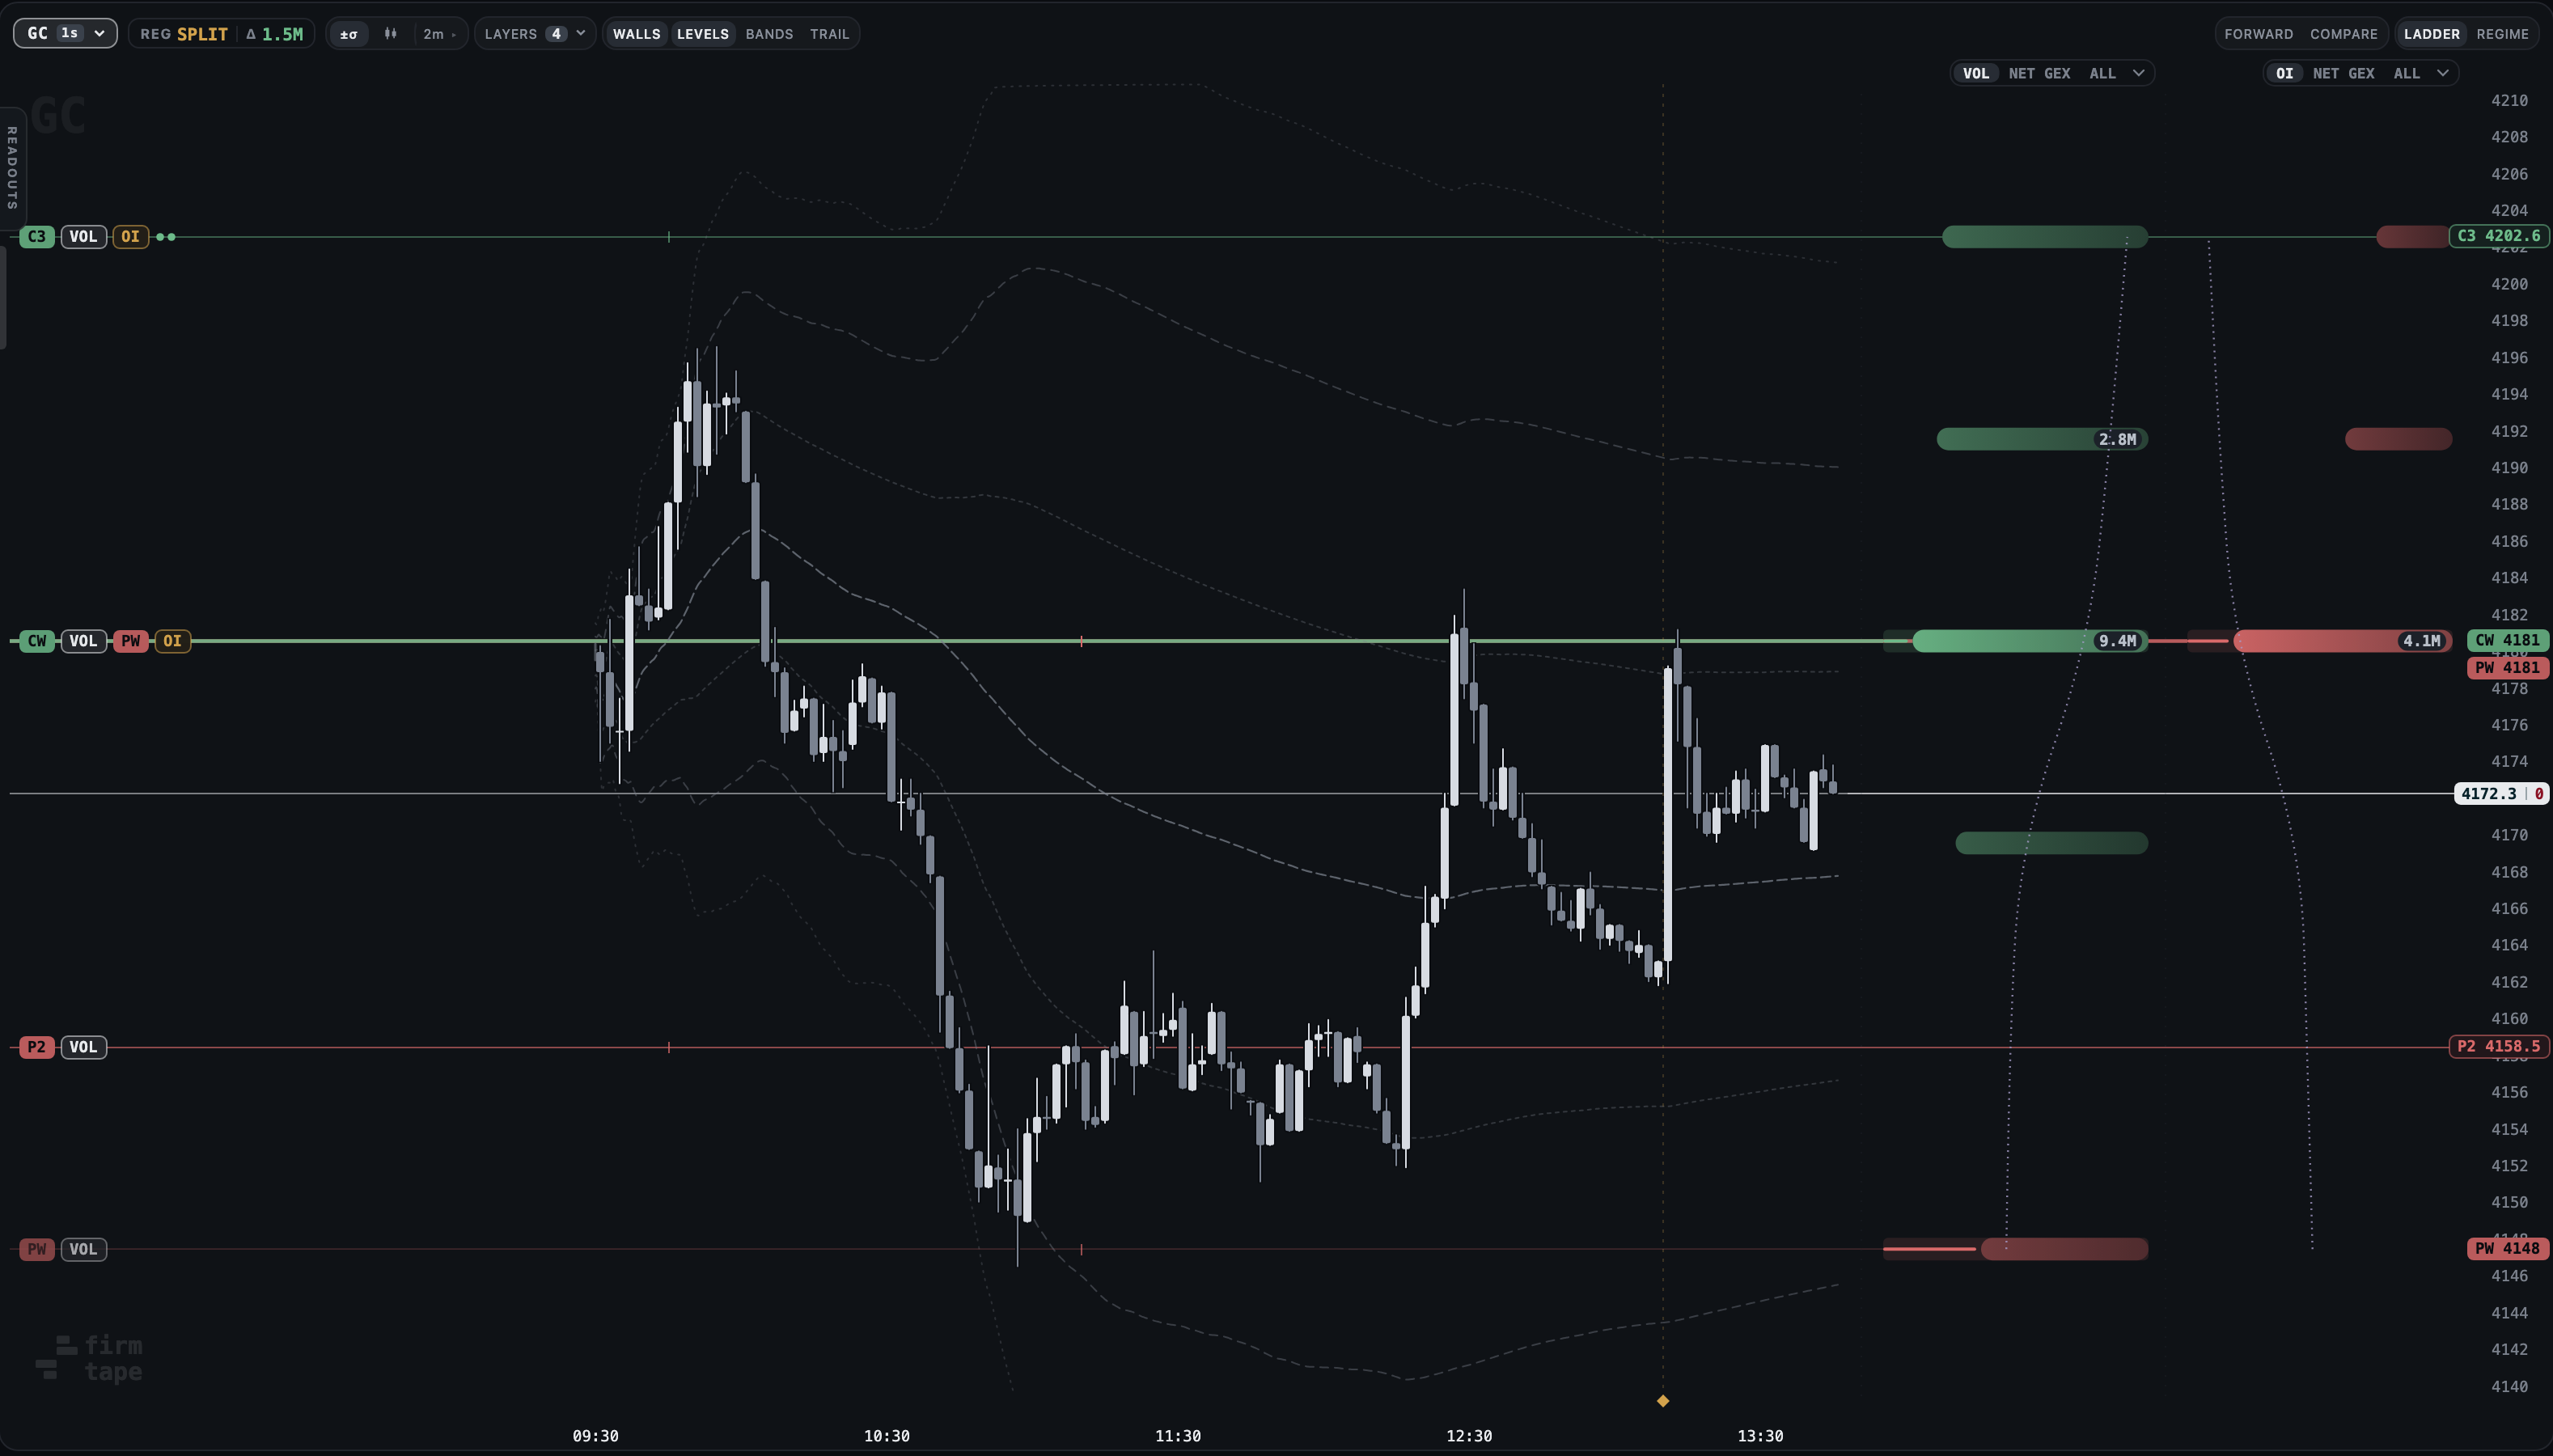
What it measures: ES and NQ are the SPX and NDX books drawn at the future's price. Every price on the chart is moved by the basis: the gap between the future and the index, read every five minutes from put-call parity on the AM-settled options of the future's own quarterly expiry. The ES price it gives sat a median 0.02 points from the real ES over 206 sessions, the NQ price 0.4 points over September 2026. RTY is the RUT book moved the same way, at RTY's 0.1 tick. GC, SI, ZB and CL take the fund's book (GLD, SLV, TLT, USO) times the ratio.
How to read it:
- Only prices move: the expected move, the regime, gamma sizes, IV and every percentage are the index book's own.
- The basis shown is the day's running median at the future's tick; it shrinks to zero at expiry and jumps at each quarterly roll, eight days before expiry.
Limits: The regular session only: the index does not trade overnight, so neither does the view. RTY has not yet been checked against real RTY prices; on a day with no measured basis the RUT levels show in index points. YM is not offered.
Related: LIVE: Symbol picker · LIVE: PREMARKET · REPLAY: ES, NQ and RTY levels
Focus mode#
Why: the chart alone, nothing around it. Where: the focus icon at the top right. Plan: LIVE for today; free on every finished session.
- Click the focus icon: the top bar and the status line go away and the chart fills the window.
- Press Escape to bring them back.
Related: LIVE: Chart layouts
Tell us what to build
DARE US#
Why: a use case the terminal does not cover yet, sent straight to the people who build it. Where: DARE US on the toolbar. Plan: Free.
- Press DARE US.
- Describe what you trade and what you want to see, and press Send.
- The card answers Got it: every request is read and answered by email.
Related: LIVE: The ASK drawer
Alerts and delivery
Alert lines#
Why: an alert where you are looking, on a fixed price or on the call wall, put wall or flip wherever the book moves it. Where: right-click the chart or a ladder row (hold for half a second on a phone); the bell on the price scale opens the line's card. Plan: LIVE.
- Right-click a price on the chart and pick Alert at 7,809.75 for a price line at that price.
- Near a wall or the flip, pick Alert when price reaches Call wall instead: a level line that follows that level as the book moves it.
- On a ladder strike the menu offers Alert at strike and Contract card; All alerts opens the list in your account.
- Drag a price line up or down to move it; the new price is saved when you let go.
- Click the bell plate on the price scale for the card: Once, Repeat or Delete.
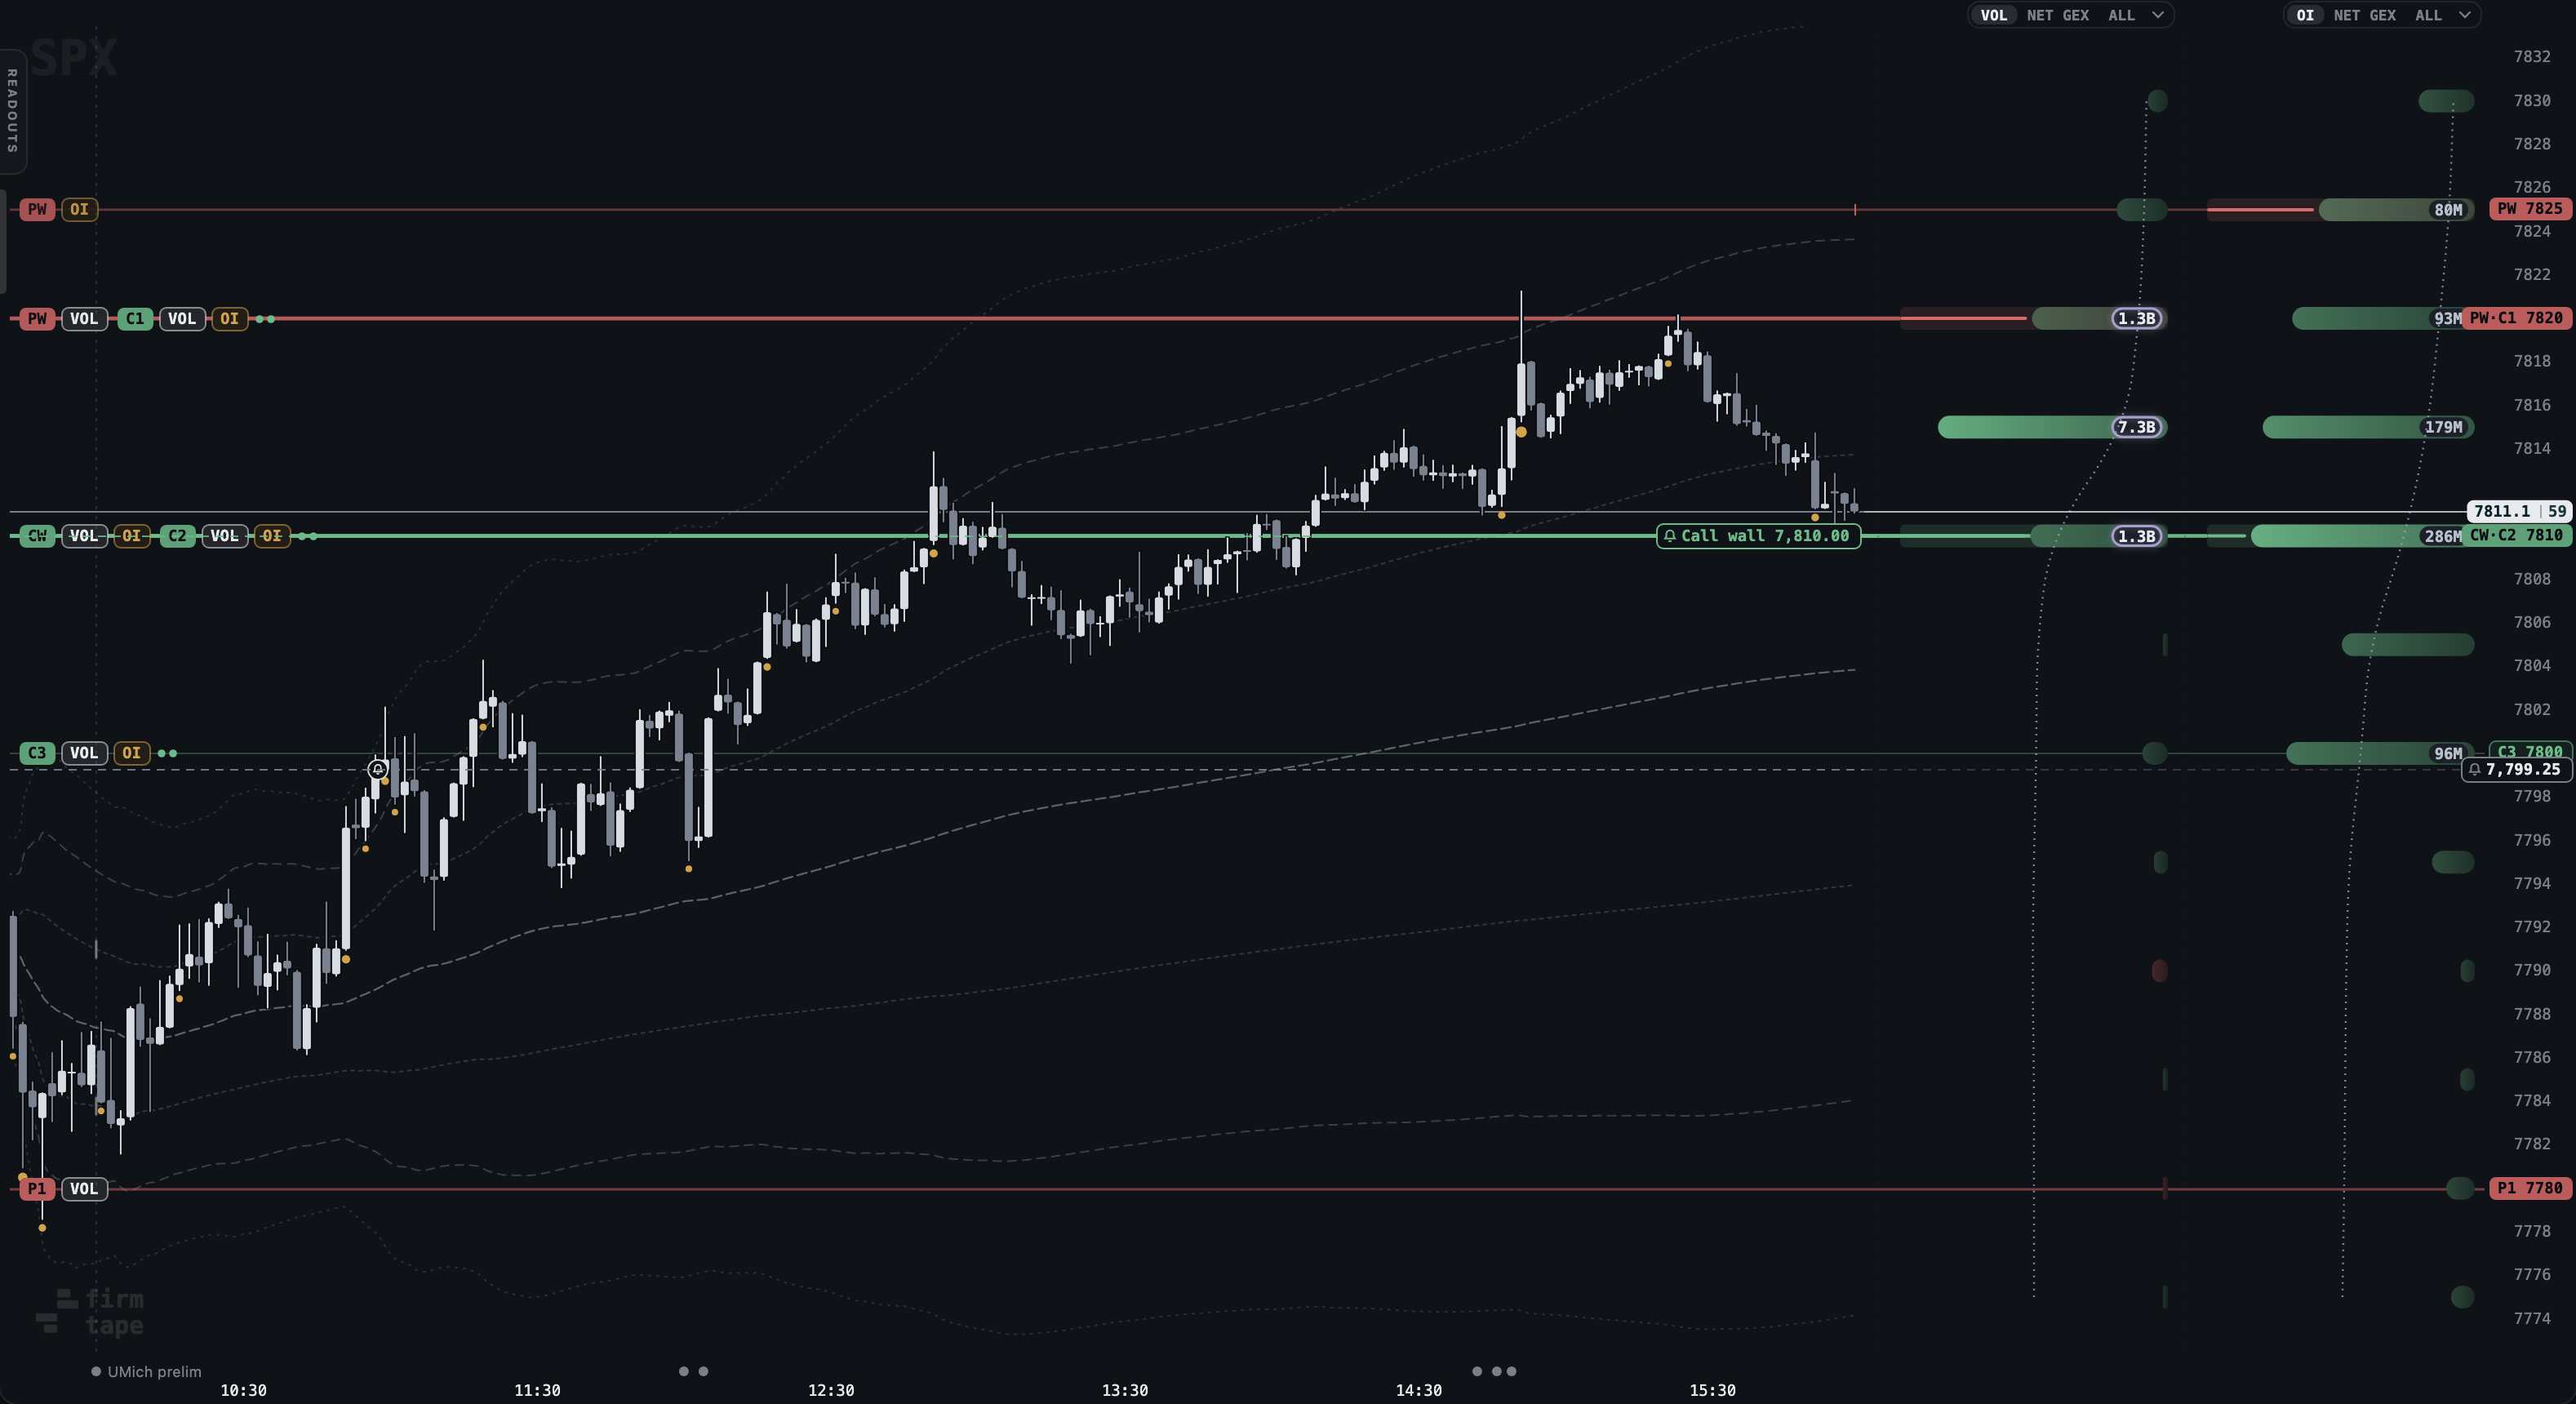
What it measures: A line fires on the first reading that crosses or touches it, with no waiting period, because you chose the price. A level line reads the volume book's flip, call wall or put wall, the levels the chart draws by default.
| Control | What it does |
|---|---|
| Alert at <price> | A price line, dashed, at that price |
| Alert when price reaches <level> | A level line on the call wall, put wall or flip, which follows it |
| Alert at strike | A price line at a ladder strike |
| bell plate | Opens the card: Once, Repeat, Delete, and when it would have fired on the day on screen |
| drag | Moves a price line; saved on release |
How to read it:
- A dashed line with a bell is a fixed price; a line named like Call wall 7,810.00 follows its level.
- A loop mark on the bell means the line repeats.
- A line says nothing about direction: it fires whichever way price meets it.
Limits: Up to 25 lines an account, kept on your account so they are on every device you sign in on. A repeating line fires again once price has been 20 SPX points away. Lines fire during the regular session only.
Developer reference: /docs/developers/live/alert-lines
Related: Alert lines, the full page · LIVE: Would-be fires on a replay · LIVE: Where alerts go · LIVE: The list of your alert lines · LIVE: Walls and levels
Would-be fires on a replay#
Why: judge a line on past sessions before trusting it live. Where: keep or set a line, then open a finished session; marks sit on the line and the card lists the times. Plan: LIVE for the lines; the sessions are free.
- Set a line, or keep one you have.
- Open a finished session from the date on the playback bar.
- Read the small bell marks on the line: each one is a moment it would have fired. Point at one for would fire HH:MM.
- Press play: the line flashes as playback crosses a would-be fire.
- Click the bell for the card, which says, for example, On Oct 9 it would have fired once (to 15:59): 12:17.

What it measures: The same firing rule as the live alert, run over the session from the open to the cursor: the first reading that crosses or touches the line, and for a repeating line every return after price has been 20 SPX points away.
How to read it:
- A mark is where the rule would have fired. It does not say what price did next.
Limits: Nothing is sent for a would-be fire. In LIVE scrubbed back, the marks cover the part of today already traded.
Related: LIVE: Alert lines · REPLAY: The playback bar
Level alerts on a watchlist#
Why: hear about the events that change the book on every symbol you follow, without a chart open for each. Where: Account, Level alerts, YOUR SYMBOLS and ALERT ME WHEN. Plan: LIVE.
- Type symbols under YOUR SYMBOLS (SPX, ES, NQ, RTY or any ticker on the chart) and press Add; the x on a chip removes it.
- Under ALERT ME WHEN, switch on the events you want.
- For The flip moves set the minimum move in points; for Price nears the flip or a wall set the distance.
- Press Save alerts. HOW ALERTS FIRE below explains the hold time and the repeat window.
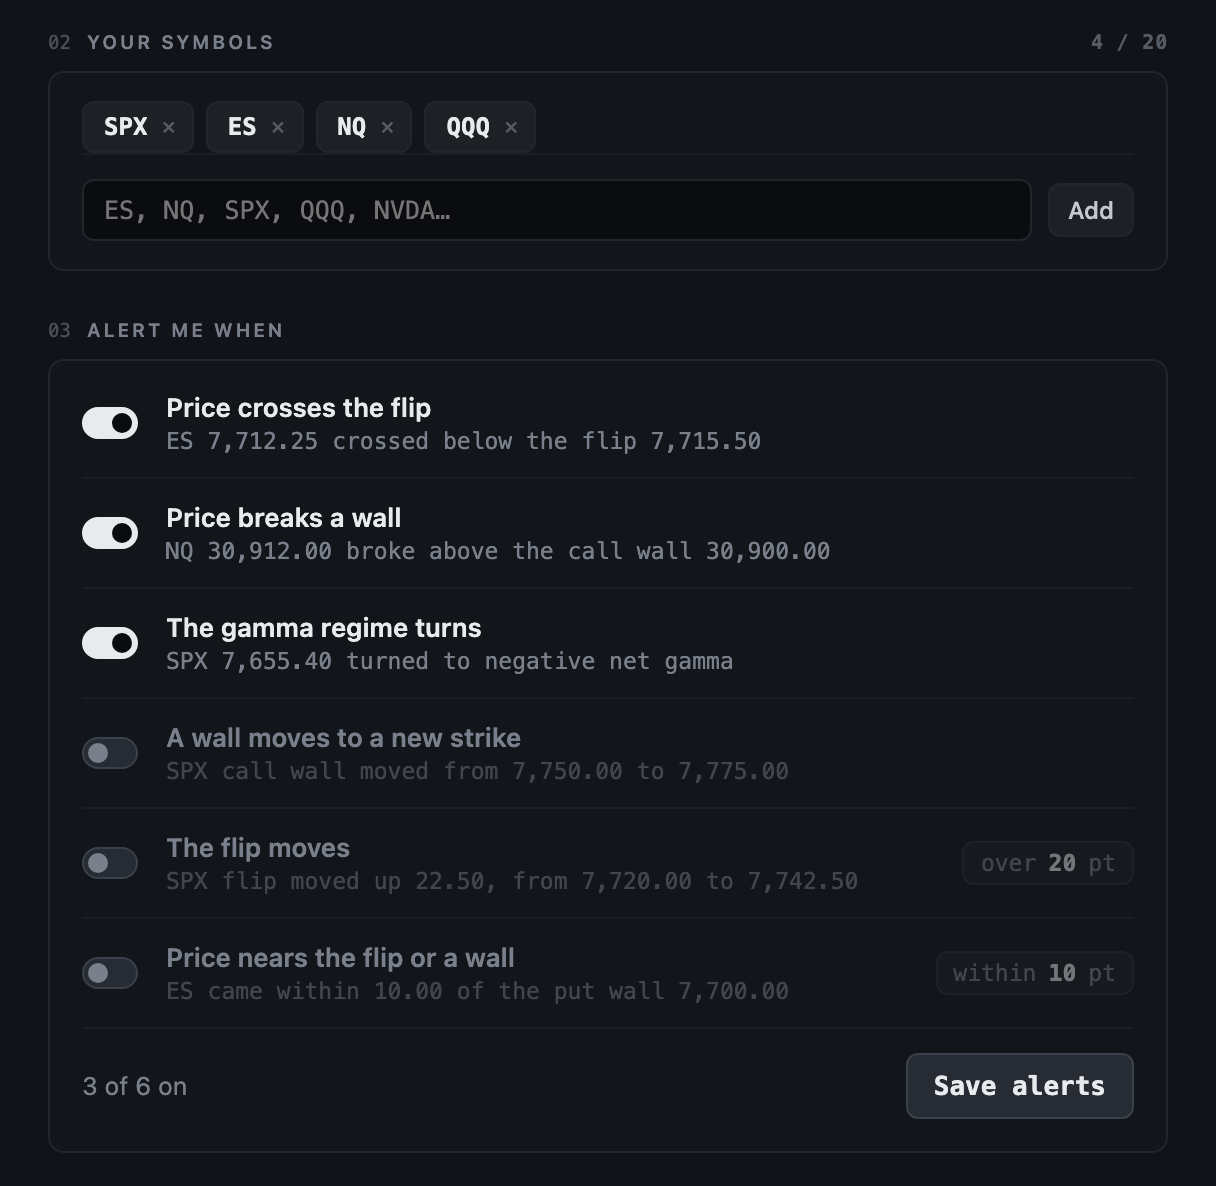
What it measures: SPX, ES and NQ are checked every few seconds against the book rebuilt each second. Other symbols read their five-minute book, and the message says so. ES, NQ and RTY are the index book moved by the day's basis.
| Control | What it does |
|---|---|
| Price crosses the flip | Price moves to the other side of the zero-gamma flip |
| Price breaks a wall | Price goes through the call wall or the put wall |
| The gamma regime turns | The book's net gamma changes sign |
| A wall moves to a new strike | The call wall or the put wall moves (off by default) |
| The flip moves | The flip moves by more than the points you set (off by default) |
| Price nears the flip or a wall | Price comes within the distance you set (off by default) |
How to read it:
- Each message carries the event, the price, the time in New York, the flip and both walls, and the book.
- A regime turning is a fact about the book, not a forecast of the next move.
Limits: Up to twenty symbols. A new side must hold for twenty seconds, and the same alert is not sent again within fifteen minutes. Regular session only.
Developer reference: /docs/developers/live/events
Related: LIVE: Where alerts go · LIVE: Webhooks · LIVE: Symbol picker · LAB: Desk alerts · Zero-gamma flip
The list of your alert lines#
Why: see all your lines across symbols, and change a line's mode without finding it on a chart. Where: Account, Level alerts, section 05, or All alerts in the chart's right-click menu. Plan: LIVE.
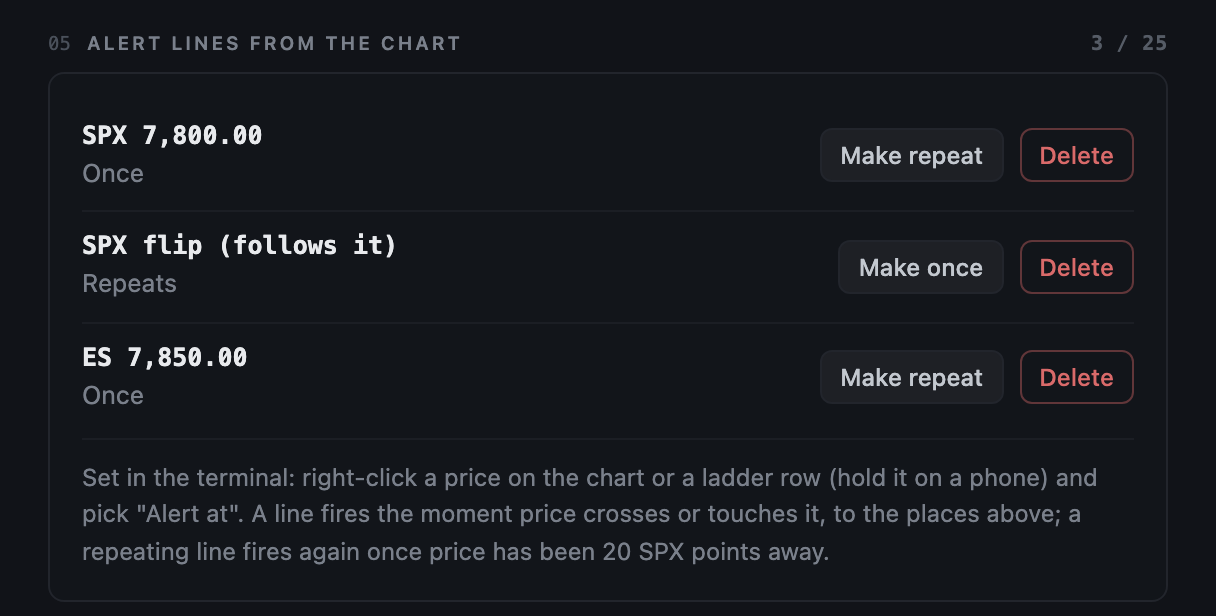
- Open the list: each line shows its symbol and price, or the level it follows (SPX flip (follows it)).
- Read Once or Repeats under each line.
- Press Make repeat or Make once to switch it, or Delete to remove it.
How to read it:
- The count on the right (3 / 25) is the lines in use against the limit.
Limits: Lines are added on the chart, not here.
Related: LIVE: Alert lines
Where alerts go#
Why: one place decides where every alert goes: level alerts, alert lines and order alerts alike. Where: Account, Level alerts, WHERE ALERTS GO. Plan: LIVE.
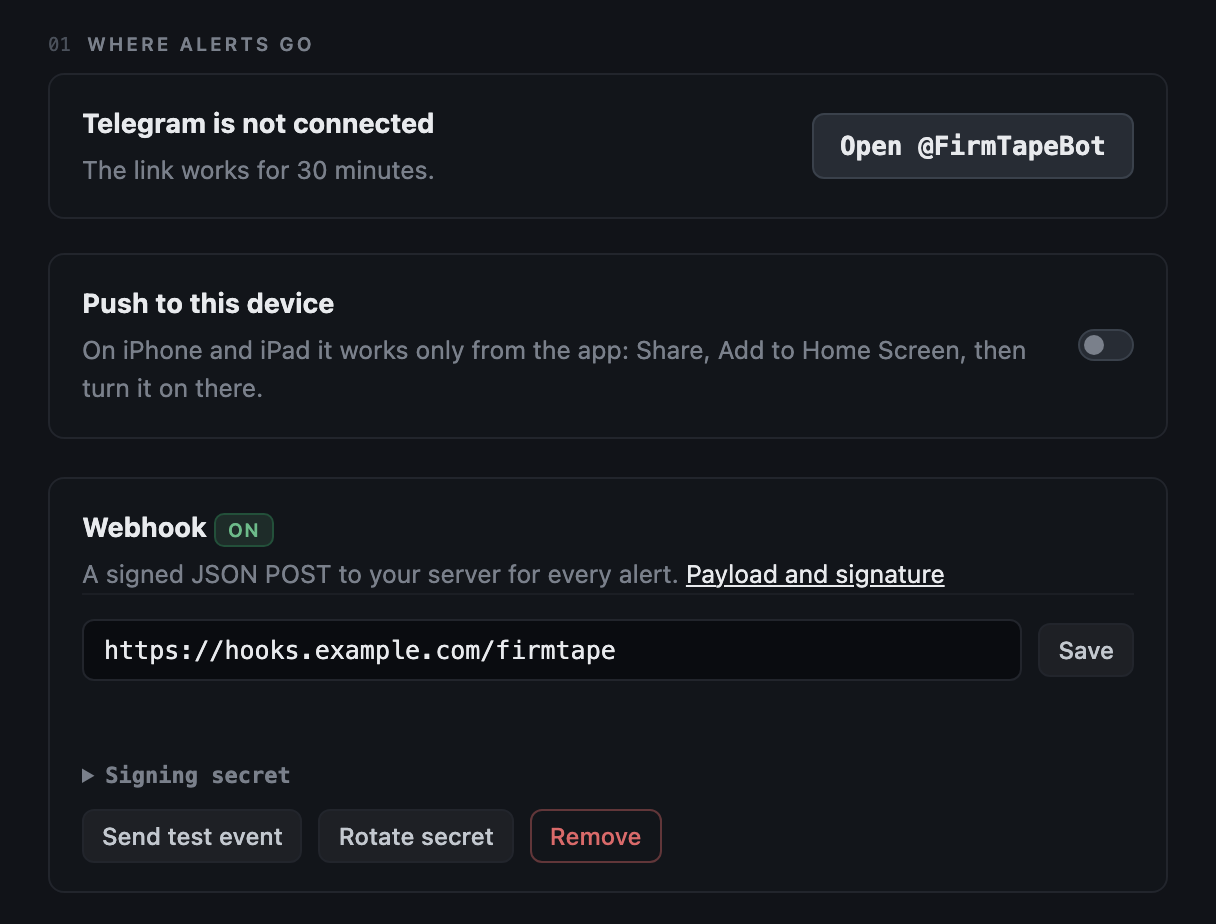
- Telegram: press Open @FirmTapeBot; the one-time link works for 30 minutes.
- Push to this device: turn the switch on, on each device that should ring. On iPhone and iPad only from the installed app.
- Webhook: paste an
https://address and press Save; Send test event checks it.
How to read it:
- An alert goes to every destination that is on. One alert is claimed once, so it goes out once.
Limits: One webhook address an account.
Related: LIVE: Telegram: @FirmTapeBot and the channel · LIVE: Notifications on your phone · LIVE: Webhooks
Telegram: @FirmTapeBot and the channel#
Why: alerts and the current levels in the chat app already on your phone. Where: Account, Level alerts, Open @FirmTapeBot; then commands in the chat. Plan: LIVE for alerts and live levels; without LIVE the bot's levels are fifteen minutes late.
- Link the chat from Account, Level alerts.
- Type
/levelsfor your list, or/levels esfor one symbol. - Use
/watch,/unwatchand/listto edit the watchlist from the chat.

| Command | What it answers |
|---|---|
| /levels | Your list, or one symbol: live with LIVE, fifteen minutes late otherwise, the last close when the market is shut |
| /gex QQQ | One symbol's book |
| /watch, /unwatch, /list | Edit and read your list from the chat |
| /session 2026-09-29 | A finished day |
| /ask | The terminal's assistant, in the same fifty questions a day |
The public channel @firmtape posts SPX, ES, NQ and four of the most opened tickers fifteen minutes late at 09:50, 12:00 and 15:45 ET, and the day's summary after the close.
Limits: Alerts reach the one chat linked to the account.
Related: LIVE: Level alerts on a watchlist · LIVE: The ASK drawer
Notifications on your phone#
Why: an alert on the lock screen with no other app to install. Where: Account, Level alerts, Push to this device, on each device. Plan: LIVE.
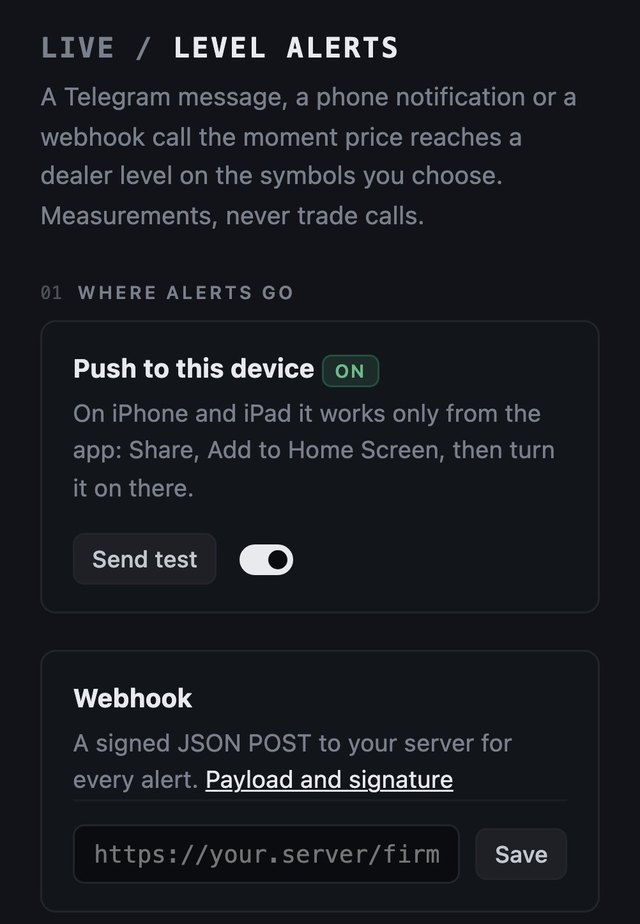
- On iPhone or iPad open firmtape.com in Safari, tap Share, then Add to Home Screen.
- Open FirmTape from the Home Screen and turn on Push to this device under Account, Level alerts.
- On Android or a desktop browser, open the same page and turn it on.
- Press Send test to check the device at once.
Limits: Push is set per device. On iPhone and iPad it works only from the installed app.
Developer reference: /docs/developers/live/web-push
Related: LIVE: Where alerts go
Webhooks#
Why: every alert as data your own code can act on. Where: Account, Level alerts, Webhook. Plan: LIVE.
- Paste one
https://address and press Save. - Press Send test event to post an event of type
test. - Open Signing secret and keep it on your server; verify every request with it.
- Rotate secret replaces it; the old one stops verifying at once.
What it measures: Every event on your list (the same symbols, events and holds as Telegram), every fired alert line and every order alert is POSTed to the address as JSON, signed with HMAC-SHA256 over the timestamp header, a dot and the raw body.
POST https://your.server/firmtape
Content-Type: application/json
X-FirmTape-Event: flip_cross
X-FirmTape-Event-Id: evt_3f9a0c6e21d4b7a8e5f10c2d
X-FirmTape-Timestamp: 1760034725
X-FirmTape-Signature: sha256=<hex HMAC-SHA256 of "<timestamp>.<raw body>">

{"version": 1, "id": "evt_3f9a0c6e21d4b7a8e5f10c2d", "type": "flip_cross",
 "symbol": "SPX", "level": {"kind": "flip", "value": 6715.5}, "price": 6712.25,
 "book": "volume", "ts": "2026-10-09T14:32:05-04:00", "day": "2026-10-09",
 "levels": {"flip": 6715.5, "call_wall": 6750, "put_wall": 6700, "put_support": 6700},
 "text": "SPX crossed below the flip 6,715.50", "direction": "below"}
| Field | What it holds |
|---|---|
| type | flip_cross, wall_break, regime_change, wall_move, flip_move, level_near; for an alert line price_alert (a price line) or level_line (a line that follows a level); for an order rule's match order (its rule and order: time, structure, legs, expiry, size, premium, points from the flip and a wall, never a side); or test |
| level | kind is flip, call_wall, put_wall or, for a regime change, net_gamma; value the level; a moved level adds from |
| levels | The book's flip, call_wall and put_wall at the event. Deprecated: put_support, the same number as put_wall, is sent until 2026-11-30; read put_wall |
| direction | above or below for a cross or an approach, up or down for a move, positive or negative for a regime |
| ts, day | When the event was found, ISO 8601 in New York time with its offset, and the ET trading day |
| id | Stable: every retry of one event carries the same id, so drop one you have seen |
| also | threshold_points for flip_move and level_near (SPX points); from and basis for ES, NQ and RTY; levels_asof for a ticker's five-minute book |
| alert | An alert line's own: id, kind (price or level), level (flip, call_wall, put_wall), price, mode (once or repeat) |
Verify every request: recompute the signature over the timestamp header, a dot and the raw body, compare in constant time, and refuse a timestamp more than five minutes old. The POSITIONS webhook is signed the same way; Geo's webhooks sign theirs differently, and the developer reference has each one and the single format all three move to. Until 2026-10-11 the POSITIONS webhook signed the raw body alone; that signature is still sent, until 2026-11-30, as X-FirmTape-Signature-V0.
// Node
const crypto = require("crypto");
function verify(rawBody, headers, secret) {
  const t = headers["x-firmtape-timestamp"], sig = headers["x-firmtape-signature"] || "";
  if (!t || Math.abs(Date.now() / 1000 - Number(t)) > 300) return false;
  const want = "sha256=" + crypto.createHmac("sha256", secret).update(t + "." + rawBody).digest("hex");
  return sig.length === want.length && crypto.timingSafeEqual(Buffer.from(sig), Buffer.from(want));
}

# Python
import hmac, hashlib, time
def verify(raw_body: bytes, headers, secret: str) -> bool:
    t = headers.get("X-FirmTape-Timestamp", "")
    if not t or abs(time.time() - int(t)) > 300: return False
    want = "sha256=" + hmac.new(secret.encode(), t.encode() + b"." + raw_body, hashlib.sha256).hexdigest()
    return hmac.compare_digest(want, headers.get("X-FirmTape-Signature", ""))
Limits: Answer with any 2xx within three seconds. No answer, a 429 or a 5xx is tried again after one and four seconds, three tries in all; redirects are not followed. Ten failed events in a row switch the webhook off, and the account page shows why; saving the address switches it back on. Up to thirty events a minute per account. An address that resolves to a private, loopback or link-local address is refused.
Developer reference: /docs/developers/webhooks
Related: Webhooks, the full page · LIVE: Where alerts go · LIVE: Level alerts on a watchlist · ORDERS: Order rules
Morning levels mail#
Why: the levels you need before the open, in your inbox, before you open the chart. Where: on by default with LIVE; Account, Mail switches it. Plan: LIVE.
- Keep Morning levels on under Account, Mail (it is on when LIVE starts).
- Read it at 08:45 New York time on each trading day.
- Switch it off with one click from the mail or under Account, Mail.
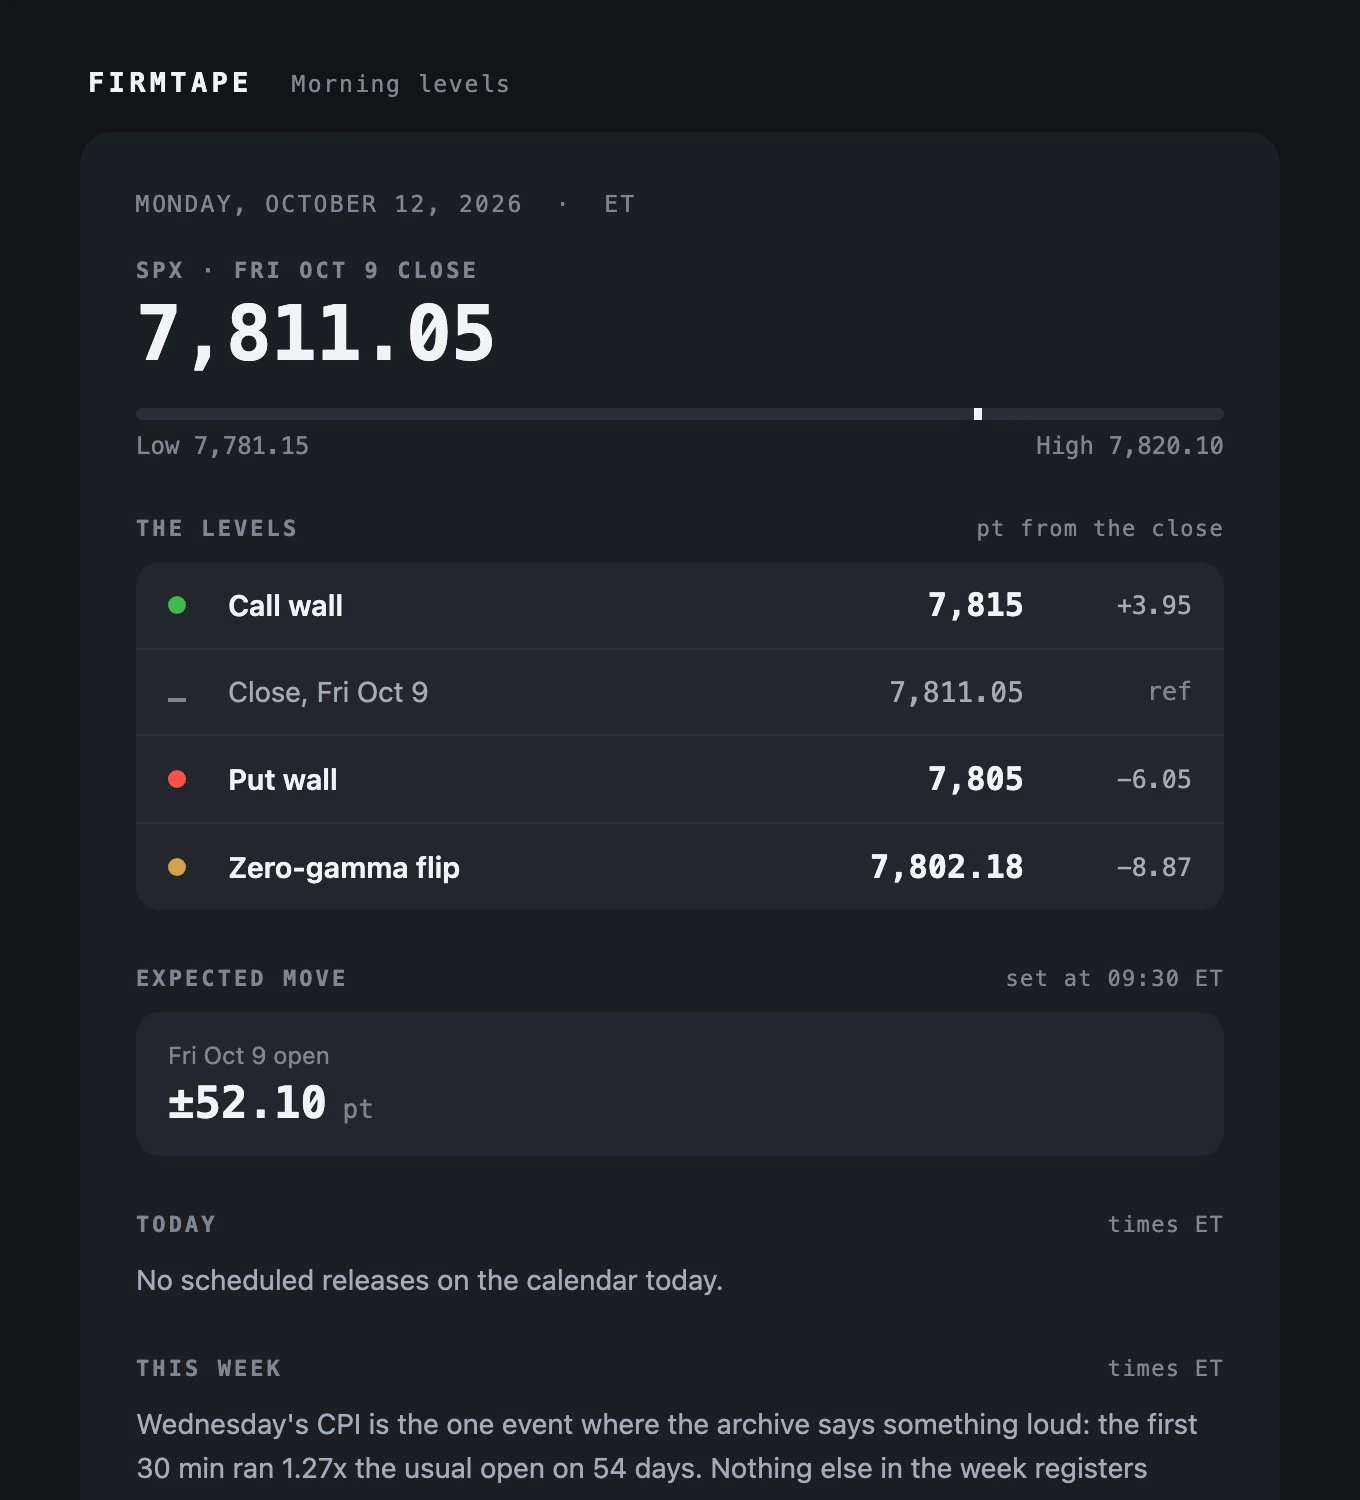
What it measures: The previous session's close, high and low; the volume book's flip and walls at 15:45 ET with their distance from the close; the expected move set at the previous open; today's scheduled releases; and on Mondays the week's events with the one that moved the archive most.
How to read it:
- The levels are the previous session's, read at 15:45 ET: the book rebuilds from the open.
- The distance column is points from the close, not a target.
Limits: Trading days only. The same Mail pane holds What's new, a mail of the terminal's changes every second Monday.
Related: Morning levels mail, the full page · LIVE: PREMARKET · LIVE: Walls and levels · LIVE: The expected move
ASK, the assistant beside the chart
The ASK drawer#
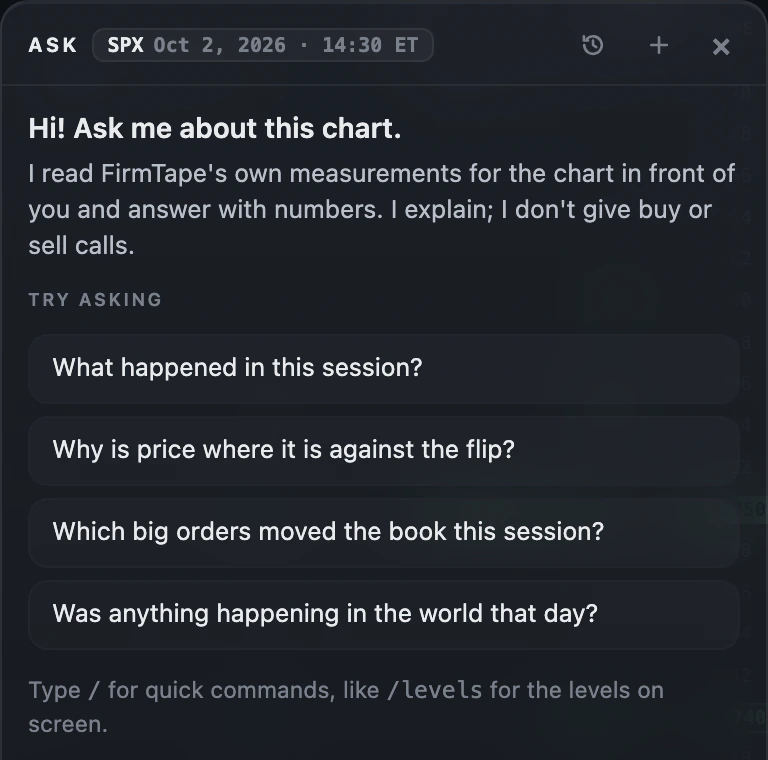
Why: questions about the chart you are looking at, answered from FirmTape's own measurements for that symbol, day and minute. Where: ASK on the toolbar (Cmd+\). Plan: any active paid plan, fifty questions a day.
- Press ASK on the toolbar, or Cmd+\.
- Pick a suggested question, or type your own and press Enter.
- Read the counter under the box: questions left today.
- Press the history button for earlier conversations, kept per session and symbol; + starts a new one.
How to read it:
- The chip in the header (SPX Oct 2, 2026 · 14:30 ET) is what ASK reads; it follows the cursor, the day and the symbol.
- The suggestions change with the chart: a replay offers questions about what happened, a live session about now.
Limits: Fifty questions a day per account, reset at midnight New York time. The drawer needs an active paid plan.
Related: LIVE: Slash commands · LIVE: Screen context and /context
Slash commands#
Why: the common look-ups in one line, without waiting for the model and without spending a question. Where: type / in the ASK box. Plan: any active paid plan.
- Type
/to open the list. - Pick a command with the arrows and press Enter, or type it in full.
- For /history, add the level:
/history 7810or/history CW.
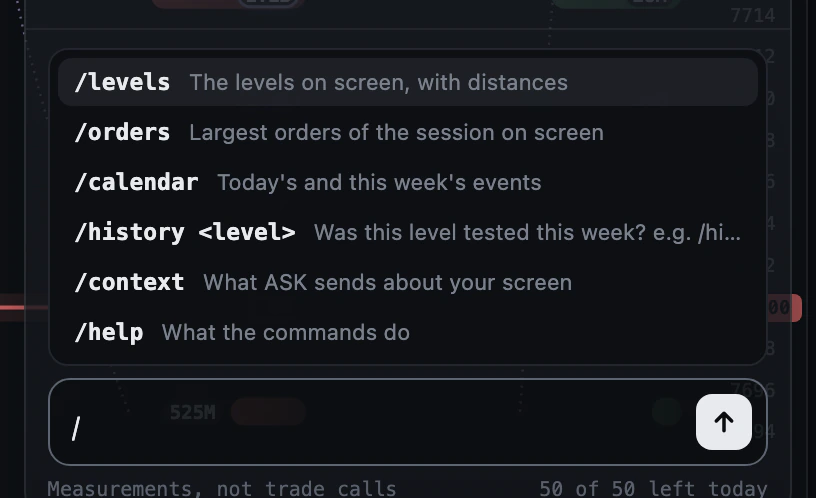
| Control | What it does |
|---|---|
| /levels | Every level on screen with its distance from price |
| /orders | The largest orders of the session on screen, ranked by the dealer gamma they added |
| /calendar | Today's and this week's events |
| /history <level> | Whether a level was tested this week (asks the model one fixed question) |
| /context | What ASK sends about your screen |
| /help | What the commands do |
How to read it:
- /orders ranks by the gamma an order added to the book, not by premium: the largest cheque is often not the largest effect.
- The /orders header says how many orders carry no known side; no answer reads a side.
Limits: All but /history answer from the data without the model and without spending a question. Today's orders need the ORDERS plan; finished sessions are free.
Related: LIVE: /levels and answer cards · ORDERS: The order ledger · REPLAY: Market calendar and pulse
/levels and answer cards#
Why: the whole level set of the minute on screen, nearest first, in one compact list. Where: type /levels; model answers that cite levels or orders carry the same rows. Plan: any active paid plan.
- Type
/levelsand press Enter. - Read the first line: how many levels, the price, and the nearest level above and below.
- Read each row: the level's name and rank, its price, its distance from price, and the VOL or OI chips of the books that carry it.
- Press COPY to take the answer as text.
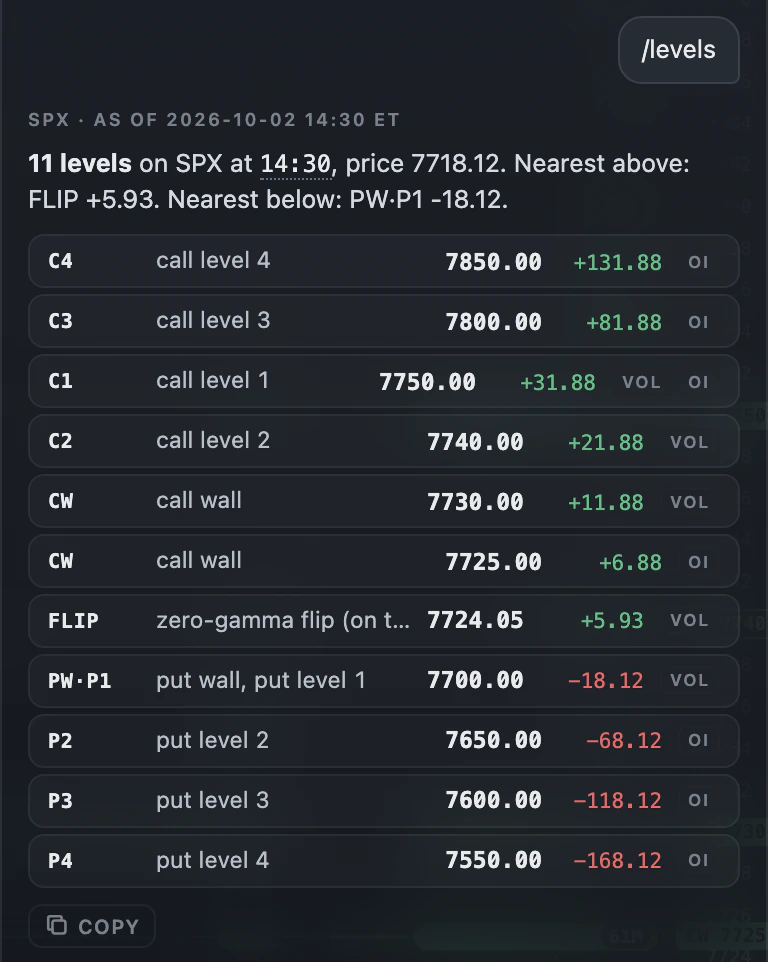
How to read it:
- Green distances are above price and red below; the colour is position, not direction.
- A row with two names (PW·P1) is two levels on one price.
- The chips name the books: VOL the volume book, OI the open-interest book.
Limits: The list is the level rows drawn on the chart at that minute, from the books shown.
Related: LIVE: Walls and levels · LIVE: Slash commands
Screen context and /context#
Why: every question carries your screen, so "this level" means the one you see; /context shows that object. Where: type /context. Plan: any active paid plan.
- Type
/contextand press Enter. - Read the object: symbol, mode (live or replay), day, minute, book, the values at the cursor and the level rows drawn.
- Press COPY to take it as text.
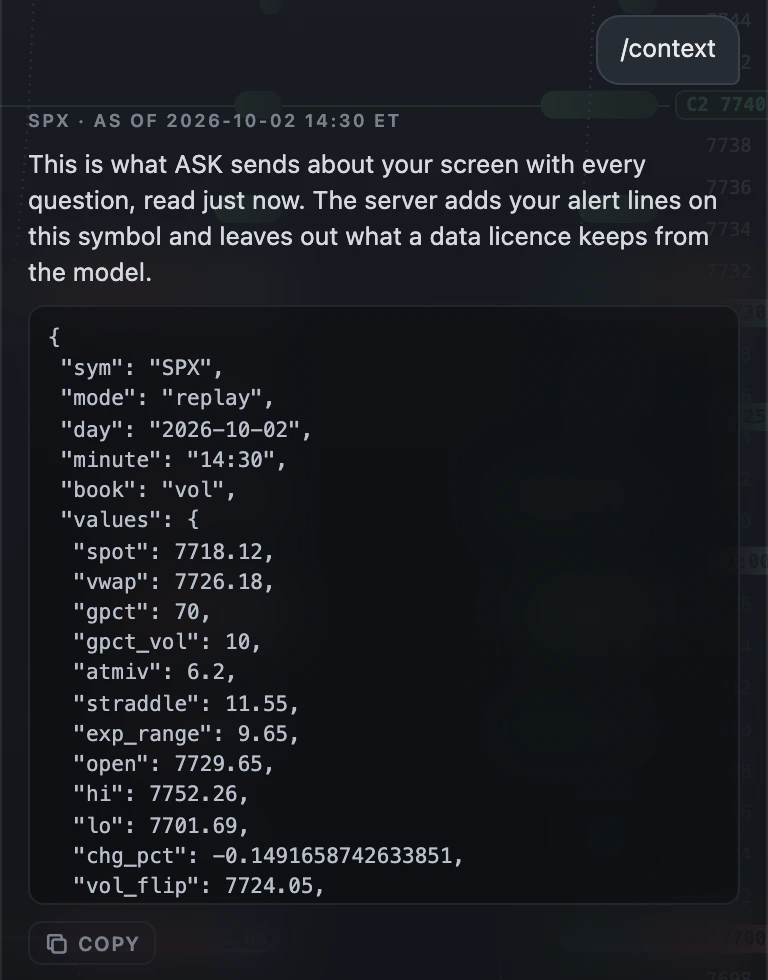
What it measures: The values are the chart's own at the minute under the cursor: spot, VWAP, the gamma percentile, ATM IV, the straddle and the expected range, the session's open, high and low, and the flip of the book on screen.
How to read it:
- The server adds your alert lines on the symbol to what the page sends.
Limits: What a data licence keeps from the model is left out of the context.
Related: LIVE: The ASK drawer · LIVE: Alert lines
Free questions and answers#
Why: a question in plain words answered in this chart's terms, with the numbers to check it. Where: type any question in the ASK box and press Enter. Plan: any active paid plan, fifty questions a day.
- Type a question, for example Why is price where it is against the flip?, and press Enter.
- While it works, the drawer says what it is reading.
- Read the answer: the symbol and minute, a short reading, then the cards it cites.
- Pick one of the follow-up questions under it, or press COPY.
- If an answer cannot be finished, press TRY AGAIN.
How to read it:
- Every time in an answer is a link that moves the replay to that minute.
- The cards under the prose are the levels and orders the answer cites, so each figure can be checked on the chart.
Limits: Each free question spends one of the fifty a day. The answer explains measurements and never gives a trade call or a forecast.
Related: LIVE: /levels and answer cards · LIVE: Screen context and /context · LIVE: Telegram: @FirmTapeBot and the channel
OPTIONS, the structure tester
The structure tester#
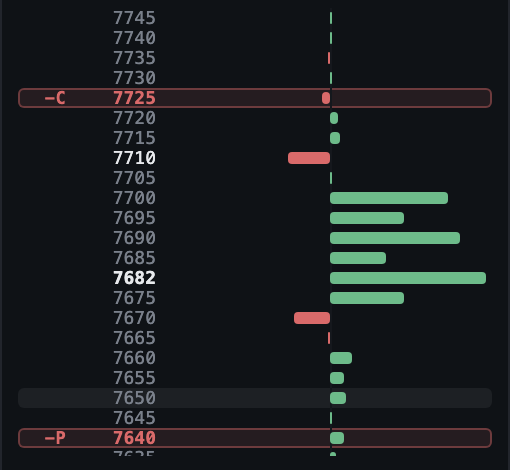
Why: a structure drawn where the book is, in a few clicks. Where: OPTIONS in the top bar; the rail opens beside the chart. Plan: Free on any finished session, with no account; live with LIVE.
- Press OPTIONS.
- Pick the side: writing the legs (short premium) or holding them (long premium).
- Pick the right: AUTO puts calls above spot and puts below; CALL or PUT forces one.
- Click strikes on the rail's ladder, up to four legs; the x on a leg removes it.
- Or press STRADDLE, STRANGLE or CONDOR, then TIGHTEN ×0.8 or WIDEN ×1.25.
| Control | What it does |
|---|---|
| side | Writing (short premium) or holding (long premium) the next leg |
| AUTO, CALL, PUT | The right of the next leg; AUTO is calls above spot and puts below |
| STRADDLE, STRANGLE, CONDOR | The standard shapes, as the research engine defines them |
| TIGHTEN, WIDEN | Rescale the whole shape by 0.8 or 1.25 |
| HELD | Pins the legs to their minute while you scrub; click to let them follow the clock |
How to read it:
- Short legs are red, long legs green, the colours the legs wear everywhere in the terminal.
Limits: SPX 0DTE, up to four legs. On another symbol the rail prices that symbol's nearest expiry, but the archive run is SPX only.
Related: LIVE: Payoff, needs and priced · LIVE: Against the book · LIVE: Ladder columns
Open an order in OPTIONS#
Why: start from a structure that actually printed in size rather than from a blank ladder. Where: ORDERS, a row's OPT button, or Open in OPTIONS in the row's detail. Plan: Free on finished sessions; today's orders with the ORDERS plan.
- Open ORDERS and find the order.
- Press OPT on its row, or open the row and press Open in OPTIONS.
- The strikes and rights load into the tester; read the structure like your own.
How to read it:
- The order's legs load as a structure; nothing about who was on which side of it is implied.
Limits: Orders of more than four legs, or not on SPX 0DTE, cannot be priced over the archive.
Related: ORDERS: The order ledger · LIVE: The structure tester
Payoff, needs and priced#
Why: the number that decides a short-premium trade, before any credit is spent. Where: the OPTIONS rail, under the structure: AT SETTLEMENT, then the tiles. Plan: Free.
- Build a structure.
- Read AT SETTLEMENT: the payoff at every possible close, the expected-move band and the breakevens.
- Read NEEDS / PRICED: the win rate to break even against the probability the market prices.
- Read KEEPS and RISKS, then the breakevens in expected moves and the risk to reward.
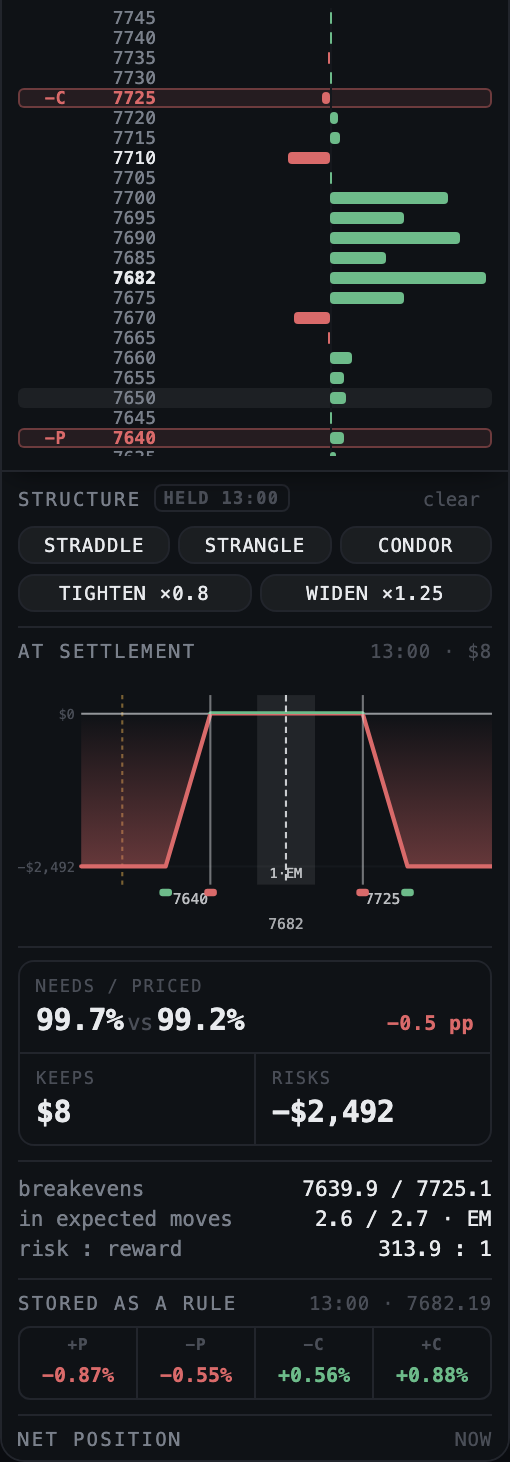
What it measures: Arithmetic off your own legs and the quotes of the minute on screen: the payoff at settlement, the breakevens, and the win rate the structure needs to break even after a $1.25 fee a leg, against the probability the market prices from the same quotes.
How to read it:
- A negative gap (needs above priced) means the market charges less than the structure needs to win.
- Breakevens in expected moves say how far price may travel before the structure loses, in the day's own units.
Limits: A reading of one minute's quotes; it says nothing about how often the structure paid in the past.
Related: LIVE: The archive run · LIVE: The expected move
Against the book#
Why: the reading no payoff calculator has, because it needs a dealer book to compare against. Where: the OPTIONS rail, NET POSITION and AGAINST THE BOOK, and the ladder beside the chart. Plan: Free.
- Build a structure on the session on screen.
- Read where each short strike sits against the measured call wall, the put wall and the zero-gamma flip.
- Scrub the session: a held structure stays put while the book moves around it.
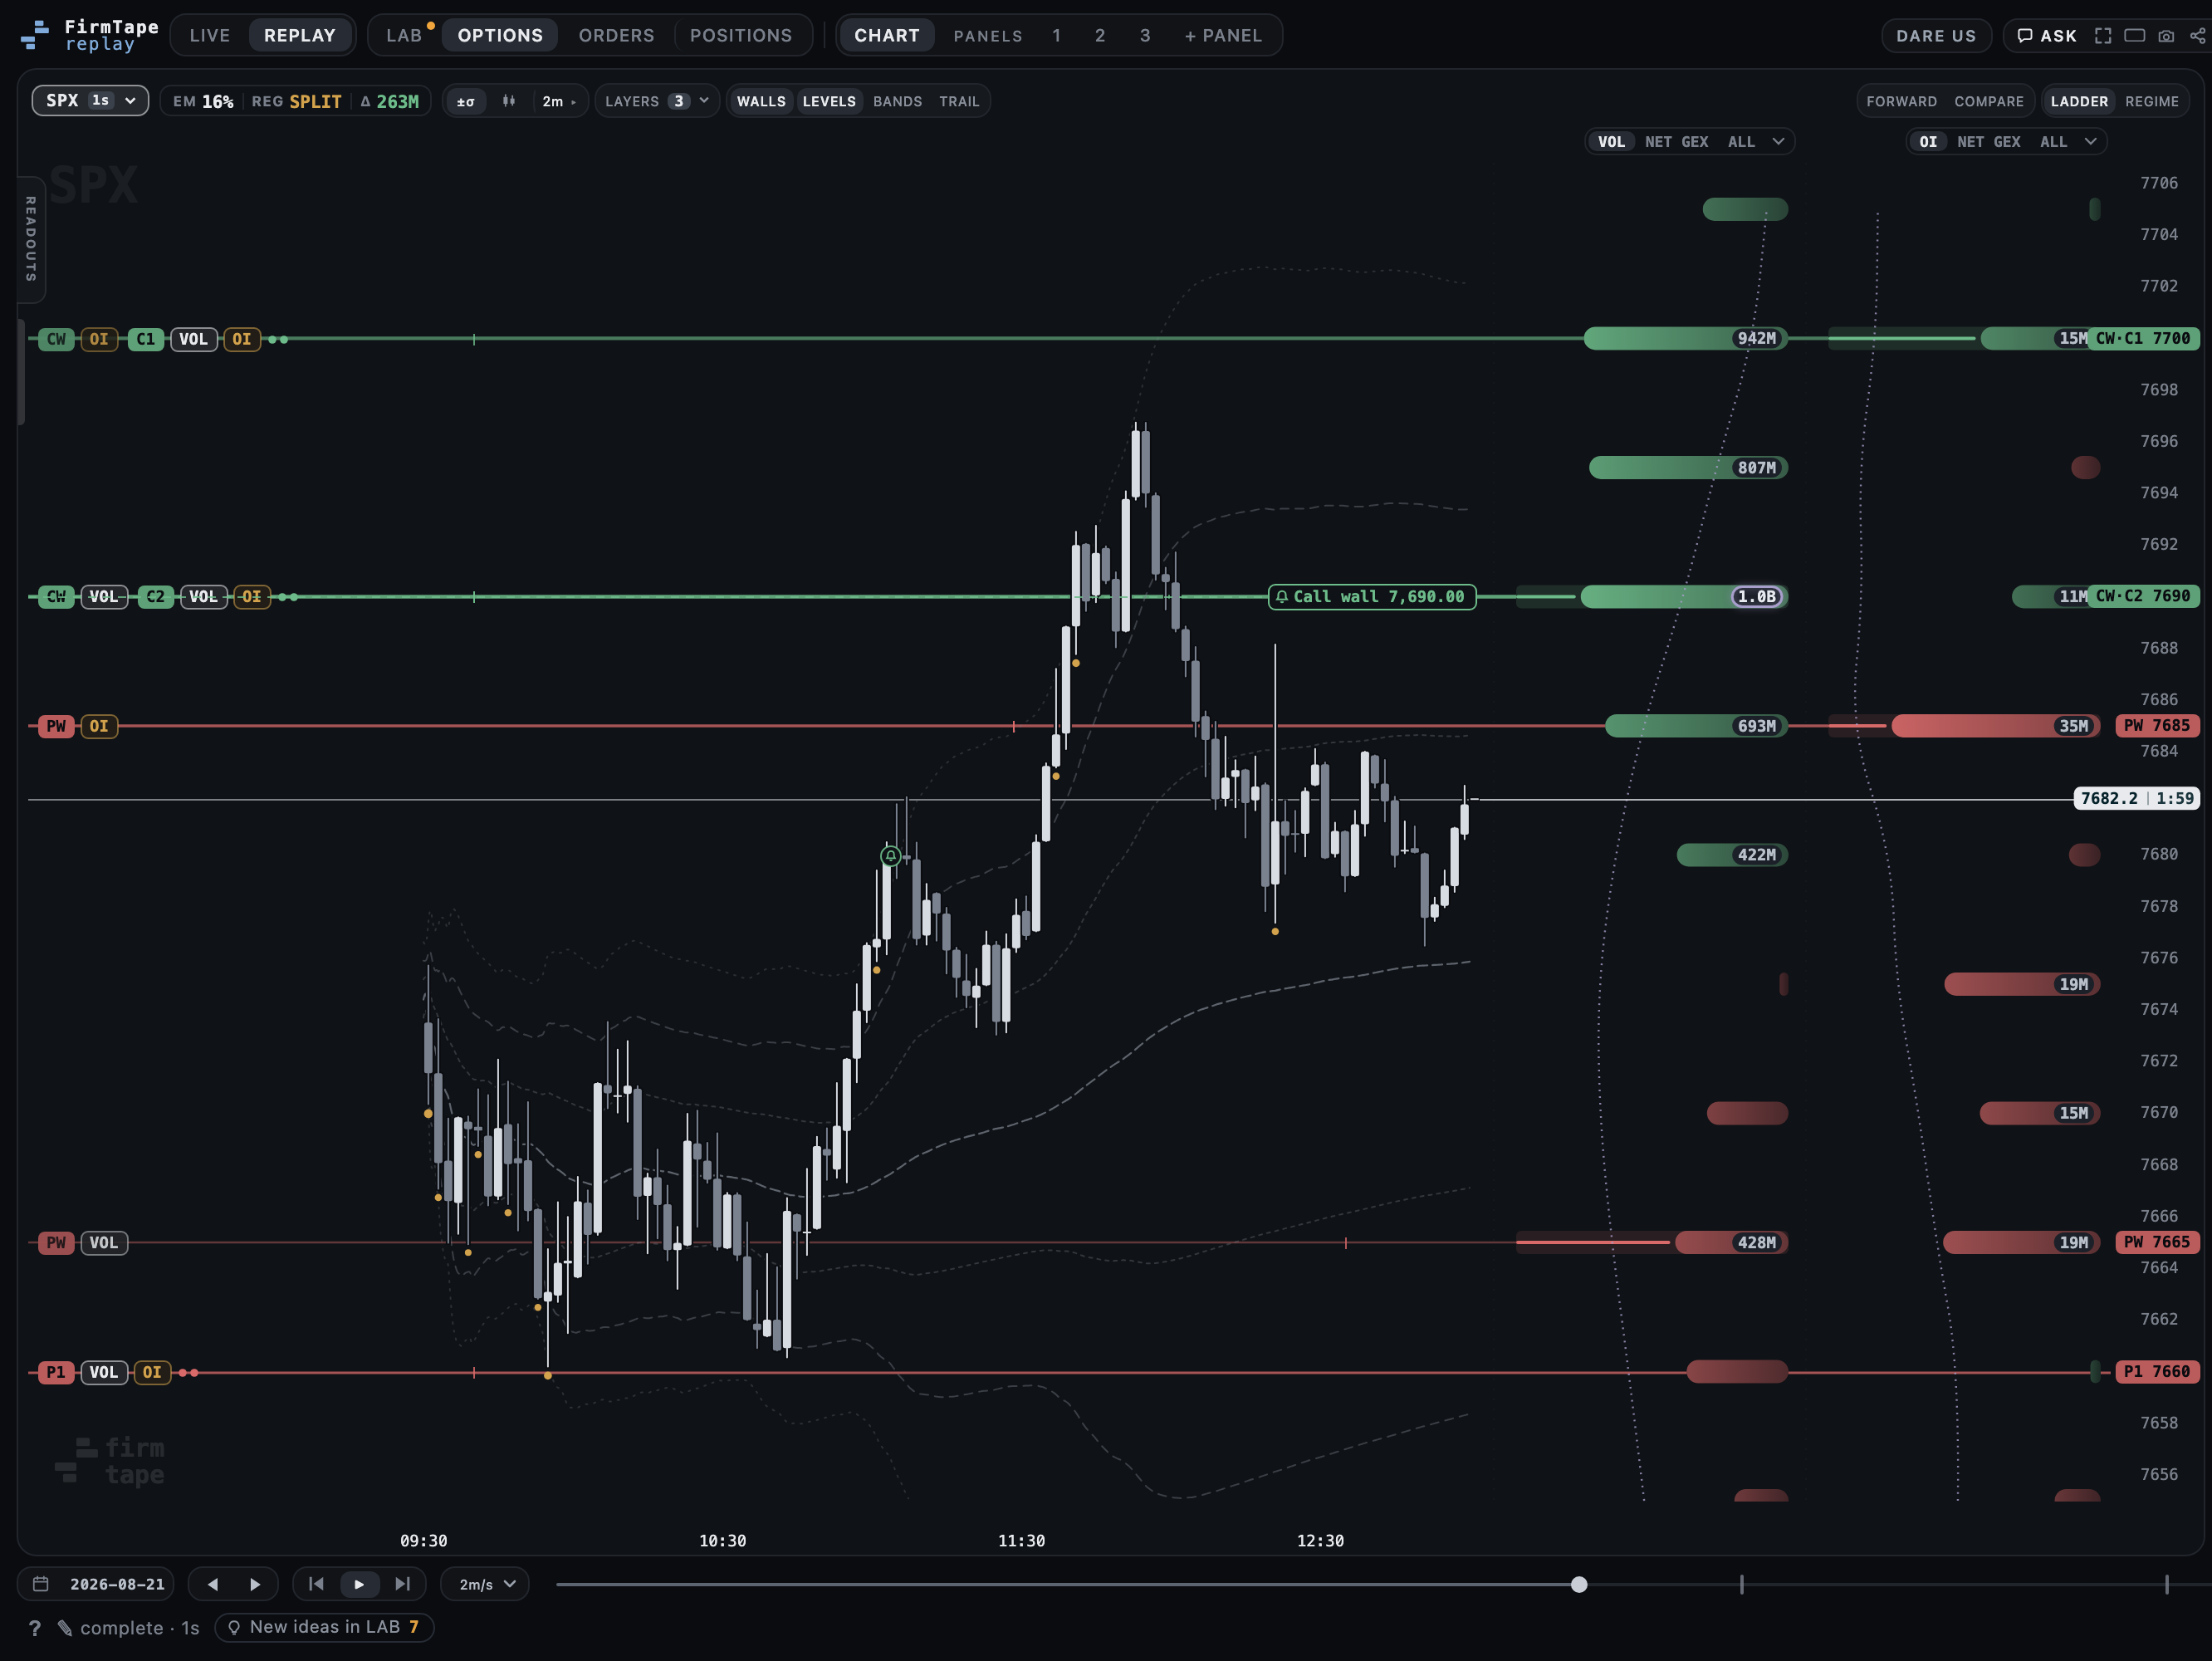
What it measures: The net position of the structure now and its distance from the levels of the measured book at the minute on screen.
How to read it:
- A short strike near a wall is near where the book is heavy; that is a position, not a forecast of the next move.
Limits: Measured on SPX; other symbols read their five-minute volume and open-interest books.
Related: LIVE: Walls and levels · LIVE: Payoff, needs and priced
The archive run#
Why: an answer from history, on real quotes and real settlement, about your own shape. Where: the run button at the foot of the OPTIONS rail; the result opens in the rail. Plan: 10 LAB credits a run; a failed run refunds them.
- Build the structure and check STORED AS A RULE: each leg as its distance from spot.
- Press the run button at the foot of the rail.
- Read the result first, then the grid under it: seven widths across nine entry times, each coloured by what it averaged.
- If the first 63 come back flat, the run carries on for the same credits: where the structure sits, past the edge of the grid, then eight standard 0DTE shapes, up to 154 configurations.
What it measures: Your geometry priced over about 1,080 archived sessions with short legs filled at the bid, long legs at the ask and $1.25 a leg. A structure collecting less than its own commission is dropped rather than counted as a small win. What it pays is shown per session and per month, on the holdout and the full sample, each with the error bar from session-to-session dispersion.
How to read it:
- Every run ends in one of three findings: a change of width or entry the archive paid for, a flat top with what it pays, or other structures that held up instead.
- A change is reported only when the gain is ordered along the stretch you would walk, clears the error bar on the difference, and a withheld holdout agrees.
- When the error bar crosses zero, the result says so instead of quoting the mean.
Limits: SPX 0DTE only, same-day expiry. The AM-settled monthly root is not ingested, and the rail says so rather than failing quietly.
Related: LAB: Credits and tokens · LAB: Quant optimize · LIVE: Payoff, needs and priced
Levels in your platform and your code
Platform integrations#
Why: the levels on the chart you already trade from, refreshed by themselves. Where: Integrations, one page per platform; the token under Account, Integrations. Plan: LIVE. Beta.
- Open Integrations and pick your platform.
- Create an integration token under Account, Integrations.
- Follow that platform's page to install the plugin and paste the token.
- For platforms that cannot fetch data, copy the levels string from the same account page and paste it into the script.
What it measures: The volume book's zero-gamma flip, call wall and put wall, optionally the open-interest levels and gamma by strike, for SPX, ES, NQ, RTY and the tickers on Symbols. Plugins that fetch refresh every few seconds.
| Platform | What you install |
|---|---|
| Sierra Chart | A study shipped as source and built by the platform itself |
| Bookmap | An add-on, or Cloud Notes with nothing to install |
| MotiveWave | A study |
| TrendSpider | A custom indicator |
| TradingView | A script that reads a pasted levels string |
| thinkorswim | A study that takes typed levels |
How to read it:
- Each plugin writes a status line naming the symbol, the contract and basis for a future, the book and how old it is.
- A line is a level of the book, not a target.
Limits: All plugins are beta. Platforms that cannot fetch data keep the pasted levels until you paste again. More platforms are being prepared and appear on Integrations when released.
Developer reference: /docs/developers/live/integrations
Related: LIVE: Integration tokens · LIVE: Levels API · LIVE: Walls and levels
Integration tokens#
Why: a key that can only read levels, one per place it is used, so each can be revoked alone. Where: Account, Integrations. Plan: LIVE.
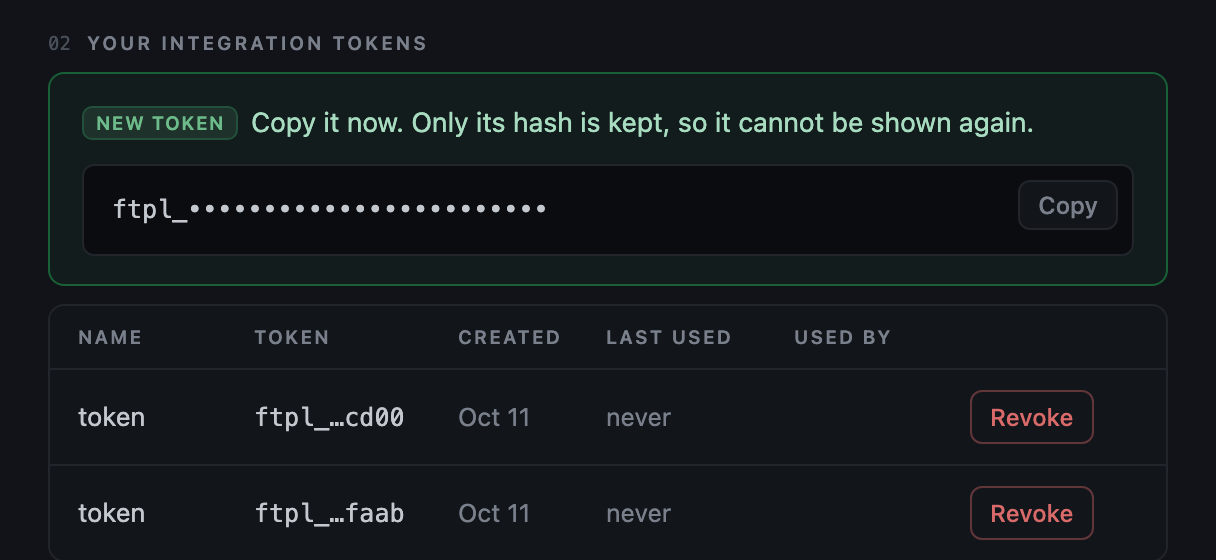
- Name the token after the platform or machine and press Create integration token.
- Copy it at once: it is shown once, then only its last characters.
- Paste it into the plugin or your script.
How to read it:
- The list shows each token's name, its last characters, when it was made and last used, and Revoke.
Limits: A token reads levels only: it cannot run LAB or spend credits.
Related: LIVE: Platform integrations · LIVE: Levels API
Levels API#
Why: the levels as data, with their book and time, for a bot, a sheet or a dashboard of your own. Where: a token from Account, Integrations; the requests are on the reference page. Plan: LIVE.
- Create an integration token under Account, Integrations.
- Send it as a bearer header with each request, as the reference shows.
- Ask for up to twenty symbols at once: SPX, ES, NQ, RTY or any ticker on Symbols.
- Add gamma by strike when you need the ladder, or the day's levels as a series.
What it measures: The volume book's zero-gamma flip, call wall, put wall and net gamma, with the open-interest book alongside. SPX's book is rebuilt every second; a ticker's every five minutes; ES, NQ and RTY are the index books moved by the day's basis.
How to read it:
- Each answer names the book and the time of the reading; a future also names its contract and basis.
- An unchanged reading answers with no body, so polling every few seconds costs little.
Limits: 120 requests a minute per token. A revoked token or an ended plan stops working within a minute. Every field and error is on the reference page, with an OpenAPI document.
Developer reference: /docs/developers/live
Related: Levels API, the full page · LIVE: Integration tokens · LIVE: Platform integrations · LIVE: Webhooks
Your own marks
Notes on a minute#
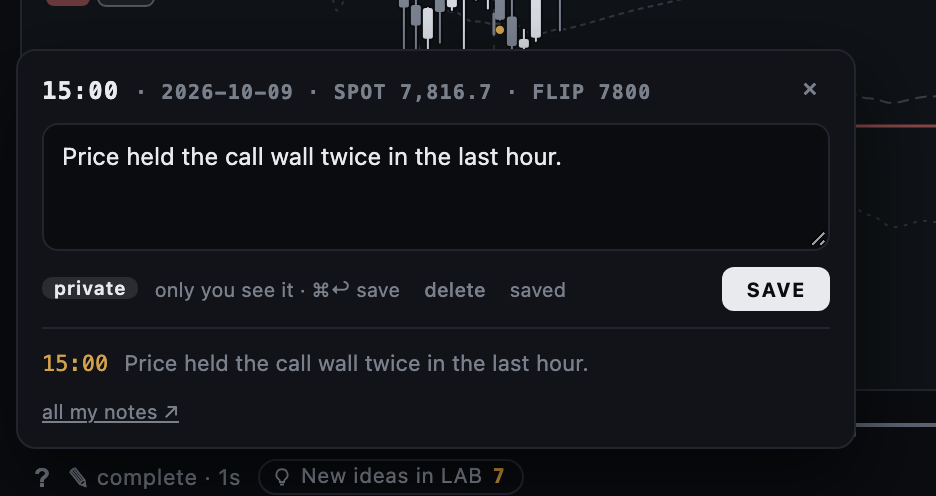
Why: a private line attached to the minute under the cursor, marked on the scrubber when you come back. Where: the pencil on the status line (N). Plan: Free with a signed-in account.
- Put the cursor on the minute and press the pencil on the status line, or N.
- The editor names the minute, the day, spot and the flip. Type your note.
- Press SAVE, or Cmd+Enter.
- The note shows as a tick on the scrubber with its text on hover; the day's notes are listed under the editor.
- all my notes opens every note at /account/notes.
How to read it:
- Only you see a note. A ?t= link to the minute is shareable; the note is not.
Limits: Notes need a signed-in account.
Related: REPLAY: Share a link to a view · REPLAY: The playback bar
Bracket: sketch a structure against the book#
Why: see your own sketch in the book's terms: how far each of its lines sits from the nearest wall or the flip, and the odds the market prices for the close landing beyond each. Where: the tool bar at the chart's left edge (the cursor, the two bracket tools and clear). Plan: LIVE for today's session; free on every finished session in REPLAY.
- Pick a bracket tool on the tool bar at the chart's left edge.
- Click the chart at the price you want to study. The stop and the target start half an expected move away (one percent of the price when the symbol has no expected move).
- Drag the stop line, the target line or the box's right edge to reshape it.
- Read the card beside it, and pick the unit it counts in: ES or MES contracts, index points or shares.
- Clear it from the tool bar. Nothing is sent anywhere; it is a sketch on your screen.
What it measures: For each line, the distance in points to the nearest call wall, put wall or flip of the book on the chart, and the odds the option chain prices for the close landing beyond that line (shown with at least thirty minutes left). The units are the symbol's own: on the ES view every price is already moved by the basis.
| Control | What it does |
|---|---|
| tool bar | The cursor, the two bracket tools and clear |
| stop and target lines | Drag to move; the card follows |
| right edge | How long the box runs, in minutes |
| unit | ES or MES contracts, NQ or MNQ, RTY or M2K, index points, or shares |
How to read it:
- The card describes the sketch, not a trade: distances, the chain's odds for the close beyond each line, and the book's levels near each line.
- Those odds are the market's own pricing of where the close lands, not a forecast of which line price meets first.
Limits: One bracket a symbol, kept in this browser until you clear it, not on your account. It is never sent to a broker or an alert.
Related: LIVE: Level card · LIVE: Walls and levels · LIVE: The expected move
Use it with other tools
| Tool | How it pairs |
|---|---|
| ORDERS: Orders on the chart | The day's largest orders as circles on the same chart. |
| ORDERS: Order rules | Order rules send new large orders to the same Telegram chat, phone and webhook as your alerts. |
| LAB: Desk alerts | A tested LAB rule draws on this chart and rings in the browser when it triggers. |
| REPLAY: The playback bar | Scrub a finished session with every layer on, and see where your alert lines would have fired. |
| REPLAY: MCP server | The free MCP server lets an assistant read the archive behind the same levels. |
Ask about it
Open ASK beside the chart and try:
| You want | Ask |
|---|---|
| The levels on screen with their distances | /levels |
| Whether a level was tested this week | /history 7810 |
| What today's events are | /calendar |
| How far each of my alert lines is | /levels, then: how far are my alert lines? |
| What the book did around a time | What changed in the book between 14:00 and 14:30? |
Good to know
- Colour is the kind of level, never the book: green the major positive-gamma strike, red the major negative, amber the flip.
- The open-interest book sums four expiries, so its net gamma is not comparable with the 0DTE books.
- A ticker's book is rebuilt every five minutes from chain snapshots, with the volume and open-interest books only: no measured book, no DEX or VEX.
- After 15:55 the expected move's left-to-close greys out: implied vol is read from a vanishing time to expiry.
- The premarket estimate is on the screen only: no file, API, alert or ASK answer carries it.
- Alerts read the volume book, the book the chart draws by default; a new side must hold for twenty seconds, and the same alert is not sent again within fifteen minutes.
- ASK answers from FirmTape's own measurements for the symbol, day and minute on screen, never from the web, and never with a trade call.
If something looks wrong
| You see | Do this |
|---|---|
| The chart says waiting for the session | LIVE runs in the regular session; outside it, pick a finished day in REPLAY or read the premarket drawer from 04:00 ET. |
| A level I saw earlier is gone | Levels below the filter share are hidden; the line under the filter says how many. Set it to 0 to see all. |
| TRAIL offers to build a grid | That day has no per-second grid yet; accept and it is built in the browser. |
| A ticker shows no measured book | Only SPX is measured print by print; tickers carry the volume and open-interest books. |
| RTY shows index points | No basis was measured for the day, so the RUT levels are shown in index points rather than invented RTY prices. |
| A line did not fire when price touched it | A line set to once has already fired and is gone. On a finished session lines never fire, they only show would-be fires. |
| No Telegram message arrives | Account, Level alerts: if Telegram shows not connected, press Open @FirmTapeBot again; the link works for 30 minutes. |
| No notification on iPhone | Push works only from the installed app: Share, Add to Home Screen, open FirmTape from the Home Screen, then turn it on there. |
| ASK says no questions left | Fifty a day; the count resets at midnight New York time. Slash commands other than /history still answer. |
| The archive run opens the credits card | The balance is below 10 LAB credits; building and reading a structure stays free. |
| A plugin shows no lines | Check the token is pasted and the plan is LIVE; the levels may be outside the visible price range, so zoom out. |
Glossary
| Term | Meaning |
|---|---|
| volume book | The 0DTE book built from the day's traded volume, signed by the call-put convention: the conventional public object. |
| open-interest book | The same construction on open interest, summed over four expiries. |
| measured book | Signed from the trade tape against the prevailing quote, print by print. |
| zero-gamma flip | The price where the book's net gamma changes sign. |
| call wall, put wall | The strikes with the largest positive and negative gamma in a book. |
| level of interest | A strike that has stood out in the VOL or OI book for a while, ranked C1, P1 and on, kept for the day. |
| expected move | The ATM 0DTE straddle, doubled to a range: what the market charges for the rest of the session. |
| basis | The gap between a future and its index, read from put-call parity on the index options. |
| alert line | One line set on the chart that fires when price crosses or touches it: a price line, or a level line that follows a wall or the flip. |
| level alert | An event on your watchlist: flip cross, wall break, regime change, wall move, flip move, price near a level. |
| AS OF | The symbol and minute an ASK answer read. |
| structure | Up to four SPX 0DTE legs built together in OPTIONS: a straddle, strangle, condor or your own. |
| integration token | A read-only key for the levels API, one per platform or machine. |
Every reading here is a measurement of dealer positioning, never a forecast or a trade call.