Features / LIVE / Heatmap: GAMMA, VANNA, CHARM
The whole session's dealer book in one picture.
The heatmap paints gamma, vanna or charm behind the candles, one cell per strike per minute, so you see where the book sat all day, which strikes it kept and which it let go, at a glance.
LIVE for today; free on every finished session.
Open the terminalIn the LIVE guide
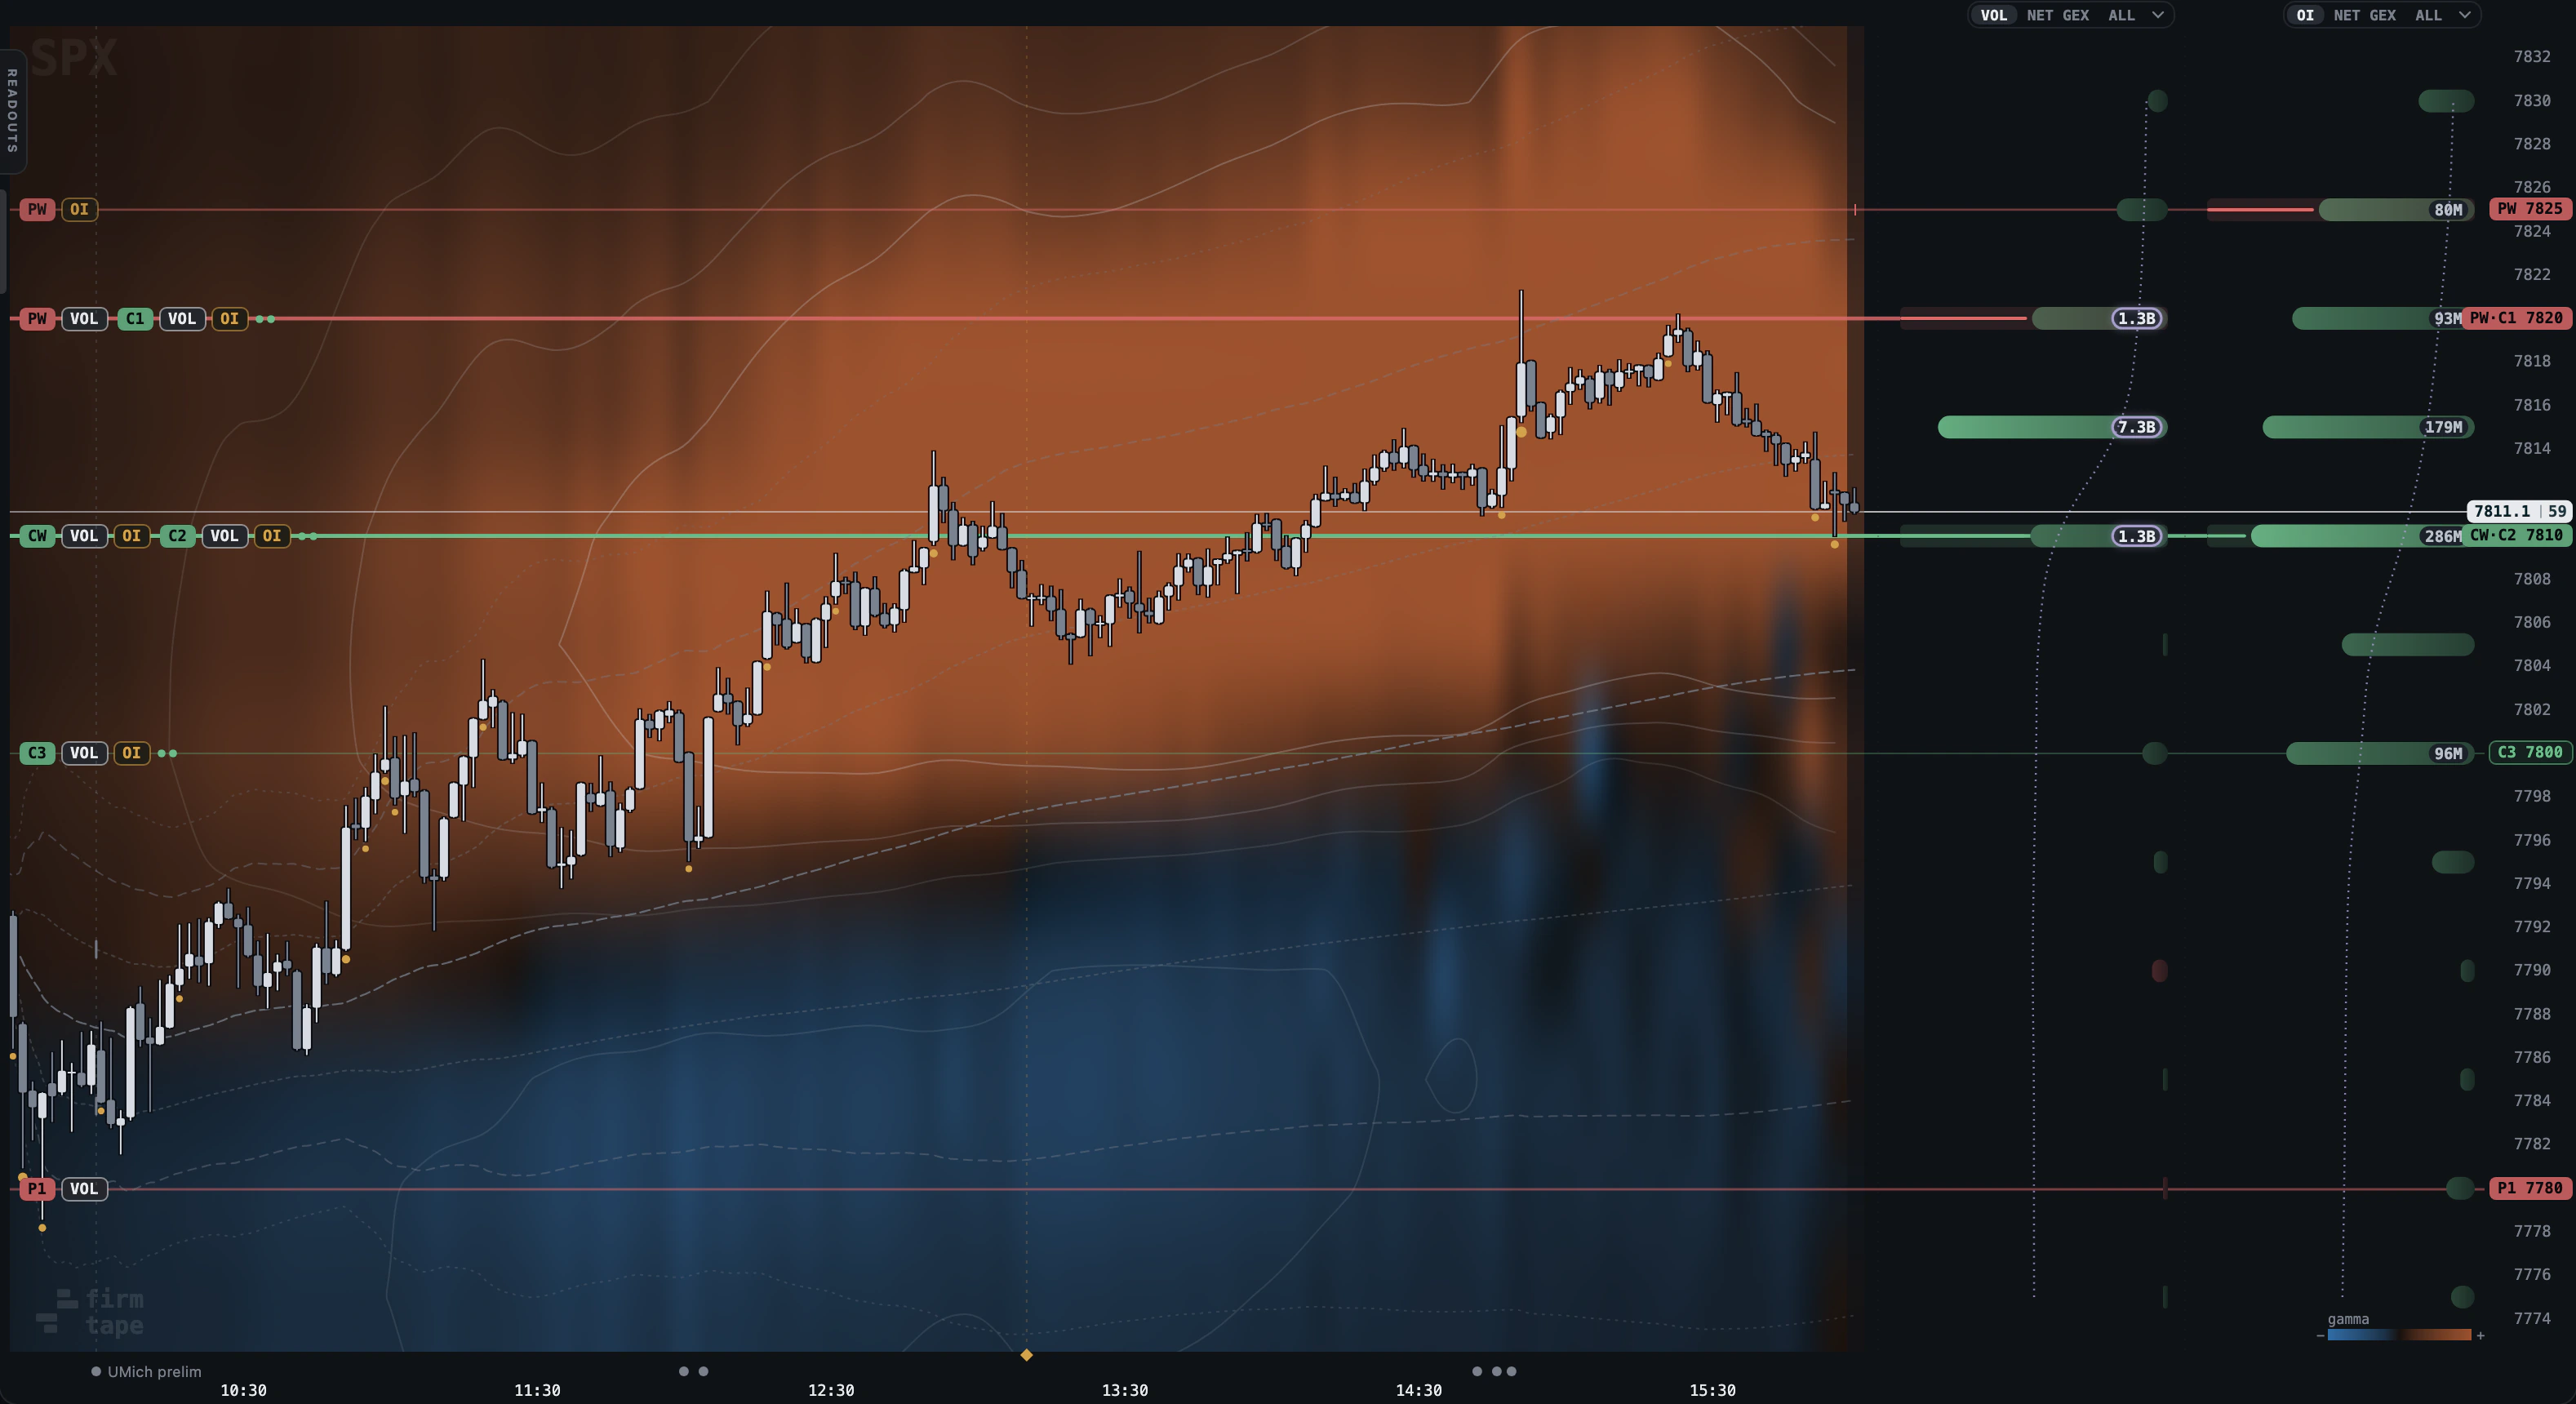
Why: the whole session's book in one picture: where gamma sat, and how it moved, minute by minute. Where: LAYERS > HEATMAP: GAMMA, VANNA or CHARM, one at a time.
How to use it
- Open LAYERS and pick GAMMA in the HEATMAP row.
- Read the colour behind each candle: one side of the legend for positive, the other for negative, brighter for more.
- Switch to VANNA to see how hedges move with implied vol, or CHARM for how they move with time to expiry.
- Turn walls and levels on with it to see which bright regions became levels.
How to read it
- Bright bands that persist are strikes the book carried all day; short flashes are flow that came and went.
- Price moving from one colour into the other is crossing between gamma regions, not a forecast.
Settings and controls
| Control | What it does |
|---|---|
| GAMMA | Where gamma sat through the day |
| VANNA | How hedges move with implied vol |
| CHARM | How hedges move with time to expiry |
What it measures
Each cell is one strike at one minute, coloured by that greek's dealer exposure in the volume book's frames. The legend at the bottom right gives the sign of each colour.
Limits
One heatmap at a time. Tickers draw vanna and charm from the volume and open-interest books.
Related
Questions
- Which book does the heatmap use?
- The volume book, the one the chart draws by default.
- What do the colours mean?
- One colour is positive exposure and the other negative, brighter for more; the legend at the bottom right names them.
- Can I show two heatmaps at once?
- No, one at a time: GAMMA, VANNA or CHARM.
- Is the heatmap a forecast?
- No. It shows where the book stood at each minute, nothing about the next one.